Disclaimer: This package is new and may be considered unstable. Use in production at your own risk.
Distributed tracing is the process of tracking the activity resulting from a request to an application. With this feature, you can:
- Trace the path of a request as it travels across a complex system
- Discover the latency of the components along that path
- Know which component in the path is creating a bottleneck
- Inspect payloads that are being sent between components
- Build execution graph for each component internals and more
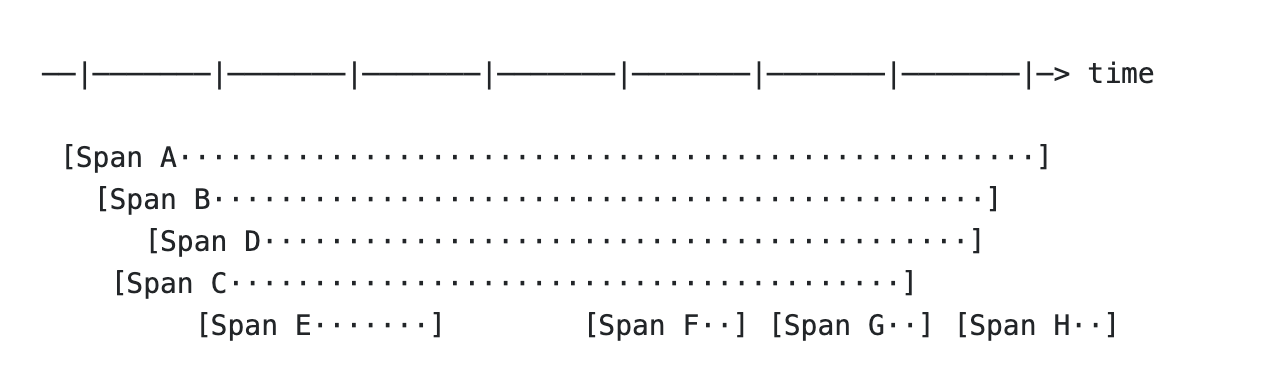
A distributed trace is composed of multiple spans, which represent time spent in services or resources of those services.
Each Span has the following:
- Operation name
- Start timestamp
- Finish timestamp
- Set of zero or more key:value tags to enable lookup and record additional information
- Set of zero or more logs paired with a timestamp
- References to related Spans (e.g. a parent)
Spans are typically displayed for your view as a time axis where each span can be unfolded to inpect additional details:
The Tracer interface (available via Trace facade) creates Spans and understands how to Inject (serialize) and Extract (deserialize) them across process boundaries.
See OpenTracing spec for more details on semantics behind distributed tracing.
This package was tested on Go >= 1.12. Although not a requirement, it would also be beneficial to use Chi router in your project for built-in HTTP middleware.
First, install the package using go get:
go get github.com/KinaneD/tracing-goAfter installation, you need to provision a singleton Tracer instance. Here is a brief example that also illustrates how you can conditionally select driver based on environment variables:
package util

import (
	"log"
	"os"

	"github.com/KinaneD/tracing-go"
	"github.com/KinaneD/tracing-go/drivers/noop"
	"github.com/KinaneD/tracing-go/drivers/zipkin"
)

var (
	Trace tracing.Tracer
)

func init() {
	var err error

	switch os.Getenv("TRACING_DRIVER") {
	case "zipkin":
		Trace, err = zipkin.NewTracer(zipkin.TracerOptions{
			ServiceName: "example",
			Host:        "localhost",
			Port:        "9411",
		})
	case "noop":
		Trace = noop.NewTracer()
	default:
		Trace = noop.NewTracer()
	}

	if err != nil {
		log.Fatal(err)
	}
}You need to specify host and port of your Zipkin collector.
tracer, err := zipkin.NewTracer(zipkin.TracerOptions{
	ServiceName: "example",
	Host:        "localhost",
	Port:        9411,
})
Note that you can also resolve hostnames (i.e. host.docker.internal) which is a feature not available in the official Zipkin libraries.
Jaeger is not officially supported yet. However, you can still post spans to Jaeger collector using zipkin driver with a compatible HTTP endpoint.
The package also includes noop driver that discards created spans.
You will work with a singleton instance that adheres to tracing.Tracer interface similarly to the one we initialized in the example above.
For simplicity, we will refer to it here as Trace.
Starting new trace is as simple as calling StartSpan method with name for a logical operation the span represents:
span := Trace.StartSpan("Create Order", Tracer.EmptySpanContext())Often, you need to continue an existing trace which is why StartSpan also accepts additional parameter for span context. SpanContext may be propagated via various channels including HTTP requests, AMQP messages, maps or even another span:
spanCtx, err := Trace.Extract(req, formats.HTTP)

rootSpan := Trace.StartSpan("Create Order", spanCtx);

childSpan := Trace.StartSpan("Validate Order", rootSpan.Context())
The possibilities are limitless. Refer to Context Propagation section for more details.
Override span name:
span.SetName("Create Order")Add tags, which may be used as lookup keys (to search span on UI) or additional details:
span.Tag("shipping_method", shippingMethod)You can retrieve the current span, which is also your most recently created span:
span := Trace.CurrentSpan()The first span you create when processing a request in the service is called a root span (not to mix with the global root span of the trace):
After you call flush, the root span is reset.
span := Trace.RootSpan()You may finish the span by calling Finish on it. Span duration is derived by subtracting the start timestamp from this:
span.Finish()You can log additional data between span start and finish. For example, Annotate creates a time-stamped event to explain latencies:
span.Annotate("Order Validated")Flush refers to the process of sending all pending spans to the transport. It will also reset the state of the tracer including the active spans and UUID:
Tracer.Flush()Make sure to call this at the end of every request.
It is recommended to structure your main() so that it calls the Close() function on the Tracer before exiting to ensure the clean shutdown of the reporter, e.g.
defer Trace.Close()This is especially useful for command-line tools that enable tracing, as well as for the long-running apps that support graceful shutdown.
It goes without saying, but you cannot send anymore spans after calling Close(), so you should only run this once during the lifecycle of the program.
Each root span is associated with a unique identifier that can be used to lookup its trace. It is recommended you include it as part of context when logging errors to bridge the gap between different parts of your monitoring stack:
Trace.UUID()Custom drivers may also support logging structured data with the span (not available in Zipkin):
Trace.CurrentSpan().Log(fields)This package includes a TraceRequests middleware for Chi router to take care of continuing the trace from incoming HTTP request.
package main

import (
	"github.com/go-chi/chi"
	"github.com/KinaneD/tracing-go/middleware"
)

func main() {
	router := chi.NewRouter()

	// tracer, slice of content-types for request and response bodies you want to log and slcie of excluded url paths
	router.Use(middleware.NewTraceRequests(Trace, []string{"application/json"}, []string{}).Handler)

	// ...
}
The middleware adds the following tags on a root span:
Request and response bodies are only included for whitelisted content-types.
type(http)request_methodrequest_pathrequest_urirequest_headersrequest_iprequest_inputresponse_statusresponse_headersresponse_content
You can override the default name of the span in the HTTP handler:
Trace.RootSpan().SetName("Create rder")As we talked about previously, the tracer understands how to inject and extract trace context across different applications (services).
We have already seen the example of extracting trace from HTTP request:
spanCtx, err := Trace.Extract(req, formats.HTTP)Of course, you may not need to do this manually because this package already includes a middleware to handle this for you, but the trace may not necessarily come from HTTP request.
The second parameter is a format descriptor that tells us how to deserialize tracing headers from given carrier. By default, the following formats are supported:
import "github.com/KinaneD/tracing-go/formats"

spanCtx, err := Trace.Extract(&carrier, formats.TextMap)
spanCtx, err := Trace.Extract(&carrier, formats.HTTP)
spanCtx, err := Trace.Extract(&carrier, formats.AMQP)
spanCtx, err := Trace.Extract(&carrier, formats.GooglePubSub)
You may also add your own format using RegisterExtractionFormat method:
Trace.RegisterExtractionFormat("pubsub", NewPubSubExtractor())The extraction format must adhere to the tracing.Extractor interface. Refer to default Zipkin implementation for example.
type Extractor interface {
	Extract(carrier interface{}) (SpanContext, error)
}
Naturally, you can also inject existing trace context from the current span into a given carrier so that another service can continue the trace:
Trace.inject(&msg, formats.AMQP)

ch.Publish(exchangeName, routingKey, false, false, msg)
By default, the following formats are supported:
import "github.com/KinaneD/tracing-go/formats"

err := Trace.Inject(&carrier, formats.TextMap)
err := Trace.Inject(&carrier, formats.HTTP)
err := Trace.Inject(&carrier, formats.AMQP)
err := Trace.Inject(&carrier, formats.GooglePubSub)
You may also add your own format using RegisterInjectionFormat method.
The injection format must adhere to the tracing.Injector interface. Refer to default Zipkin implementation for example.
type Injector interface {
	Inject(spanCtx SpanContext, carrier interface{}) error
}
You can also use InjectContext method if you need to pass span context explicitly:
Trace.injectContext(&carrier, formats.TextMap, span.Context());IMPORTANT: You don't need to create a custom propagation format if you need to get something done quickly. You can always avail of the default TextMap format to inject or extract tracing headers from a map.
New drivers must adhere to tracing.Tracer contract. Refer to the default Zipkin imlementation for example.
package tracing

type Tracer interface {
	StartSpan(name string, spanCtx SpanContext) Span
	RootSpan() Span
	CurrentSpan() Span
	UUID() string
	EmptySpanContext() SpanContext
	Extract(carrier interface{}, format string) (SpanContext, error)
	Inject(carrier interface{}, format string) error
	InjectContext(carrier interface{}, format string, spanCtx SpanContext) error
	RegisterExtractionFormat(format string, extractor Extractor)
	RegisterInjectionFormat(format string, injector Injector)
	Flush()
	Close() error
}
Registering new driver is as simple as adding another clause to a switch statement where you initialize Tracer instance. For example, if you have written a Jaeger tracer, you may register it like so (we continue with example from installation instructions):
var Trace tracing.Tracer

switch os.Getenv("TRACING_DRIVER") {
case "jaeger":
	Trace = jaeger.NewTracer()
default:
	Trace = noop.NewTracer()
}
Once your driver has been registered, you may specify it as your tracing driver in your environment variables:
TRACING_DRIVER=jaeger go run main.go