simple parsing, hack cleaning, dumb quick analysis.
all for gamithra mood
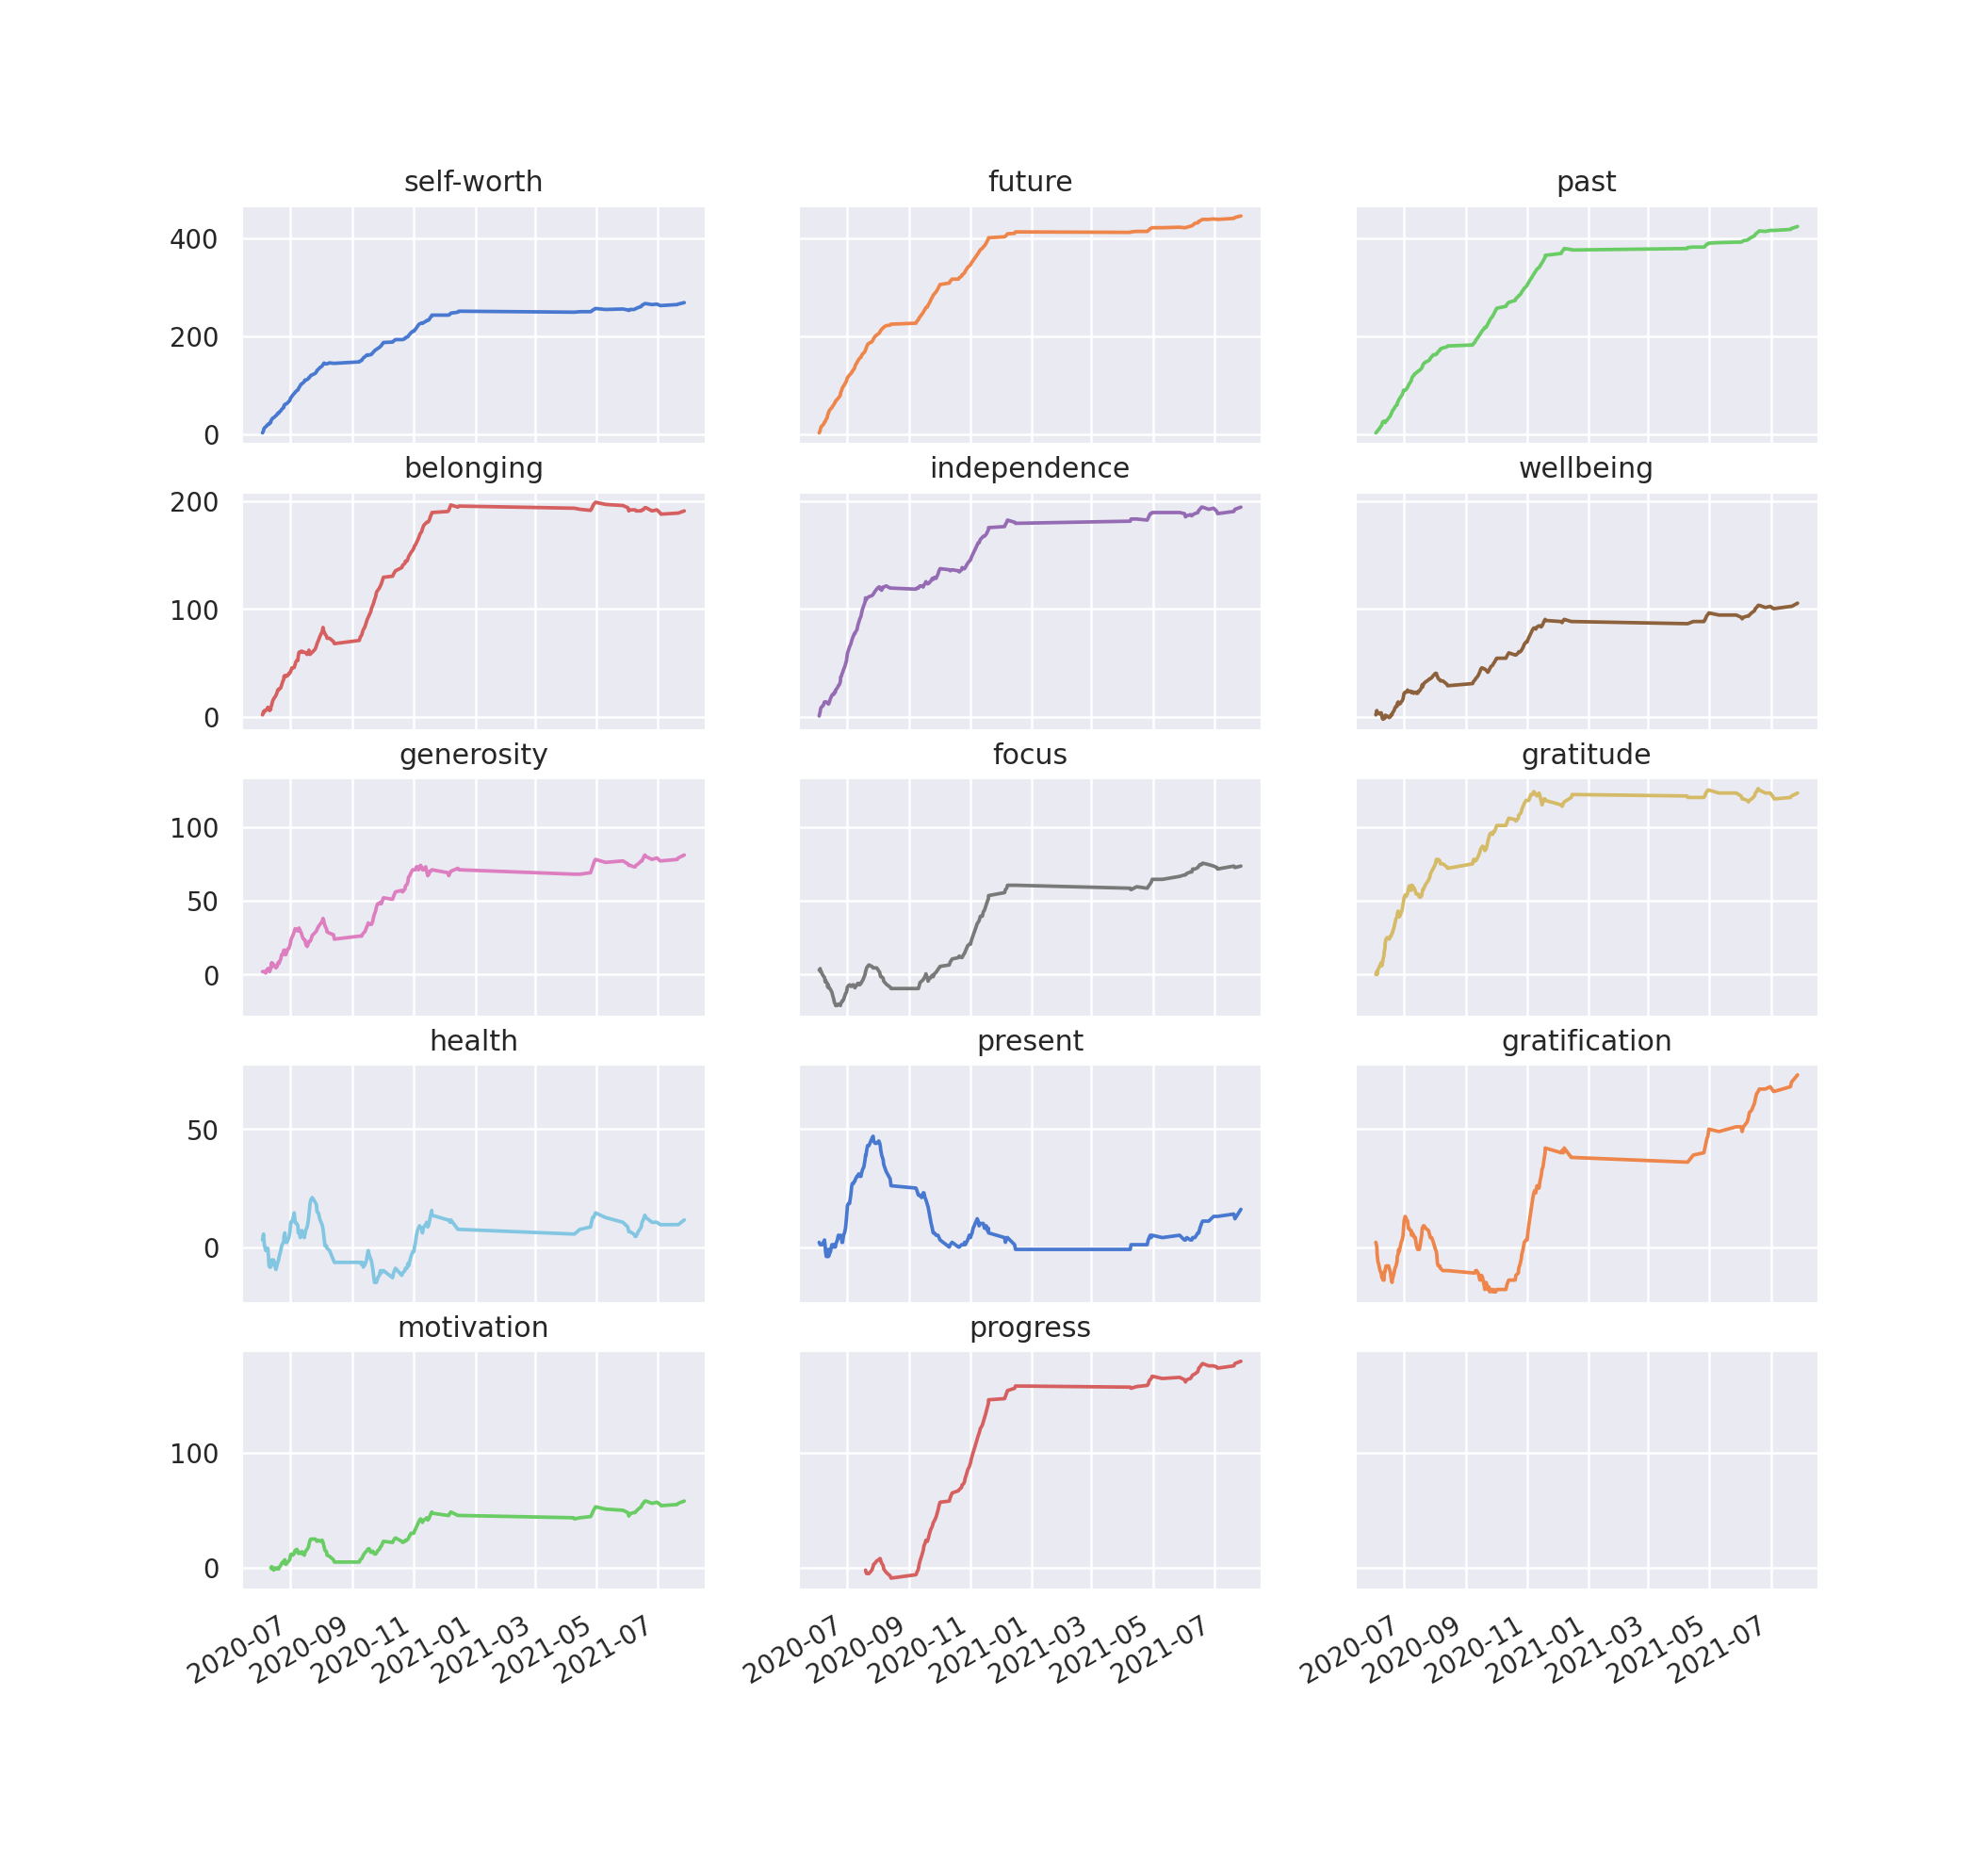
Plot goes up when the measure is on the positive side (> 5), down when on the negative side (< 5). measure == 5 is straight.
PCA's first component explains about 39% of the variance, second about 18%, and it goes down from there.
This does mean that just using PCA isn't a very good indicator of what's going on here, but this is supposed to be quick and dirty so ¯\_(ツ)_/¯
Inside that 39%, we can check how much different features help explain all other features:
| feature | importance |
|---|---|
| health | 0.412 |
| wellbeing | 0.39 |
| generosity | 0.348 |
| present | 0.33 |
| belonging | 0.32 |
| gratitude | 0.308 |
| gratification | 0.26 |
| focus | 0.239 |
| independence | 0.209 |
| self-worth | 0.203 |
| future | 0.131 |
| past | 0.08 |
There are two things we can gleam from that table above:
- if we had to only choose one stat to track
healthwould make the most sense. that also means that improving health would give the biggest returns on improving all stats. - the feelings about the past or the future don't seem to matter too much in explaining all other stats
For reference, here's the table for the second component:
| feature | importance |
|---|---|
| belonging | 0.49 |
| gratification | 0.414 |
| gratitude | 0.39 |
| health | 0.36 |
| generosity | 0.304 |
| independence | 0.28 |
| focus | 0.206 |
| present | 0.201 |
| self-worth | 0.14 |
| past | 0.091 |
| future | 0.056 |
| wellbeing | 0.012 |