Hello, I wrote a short introduction about this code.
In the repository there is a main code written on Colab and a excel file which is refered in medium article "How to draw a bar graph for your scientific paper with python"
Under my profil https://medium.com/@yefengxia
The main packages used in my code are numpy, pandas and matpotlib in python 3.7
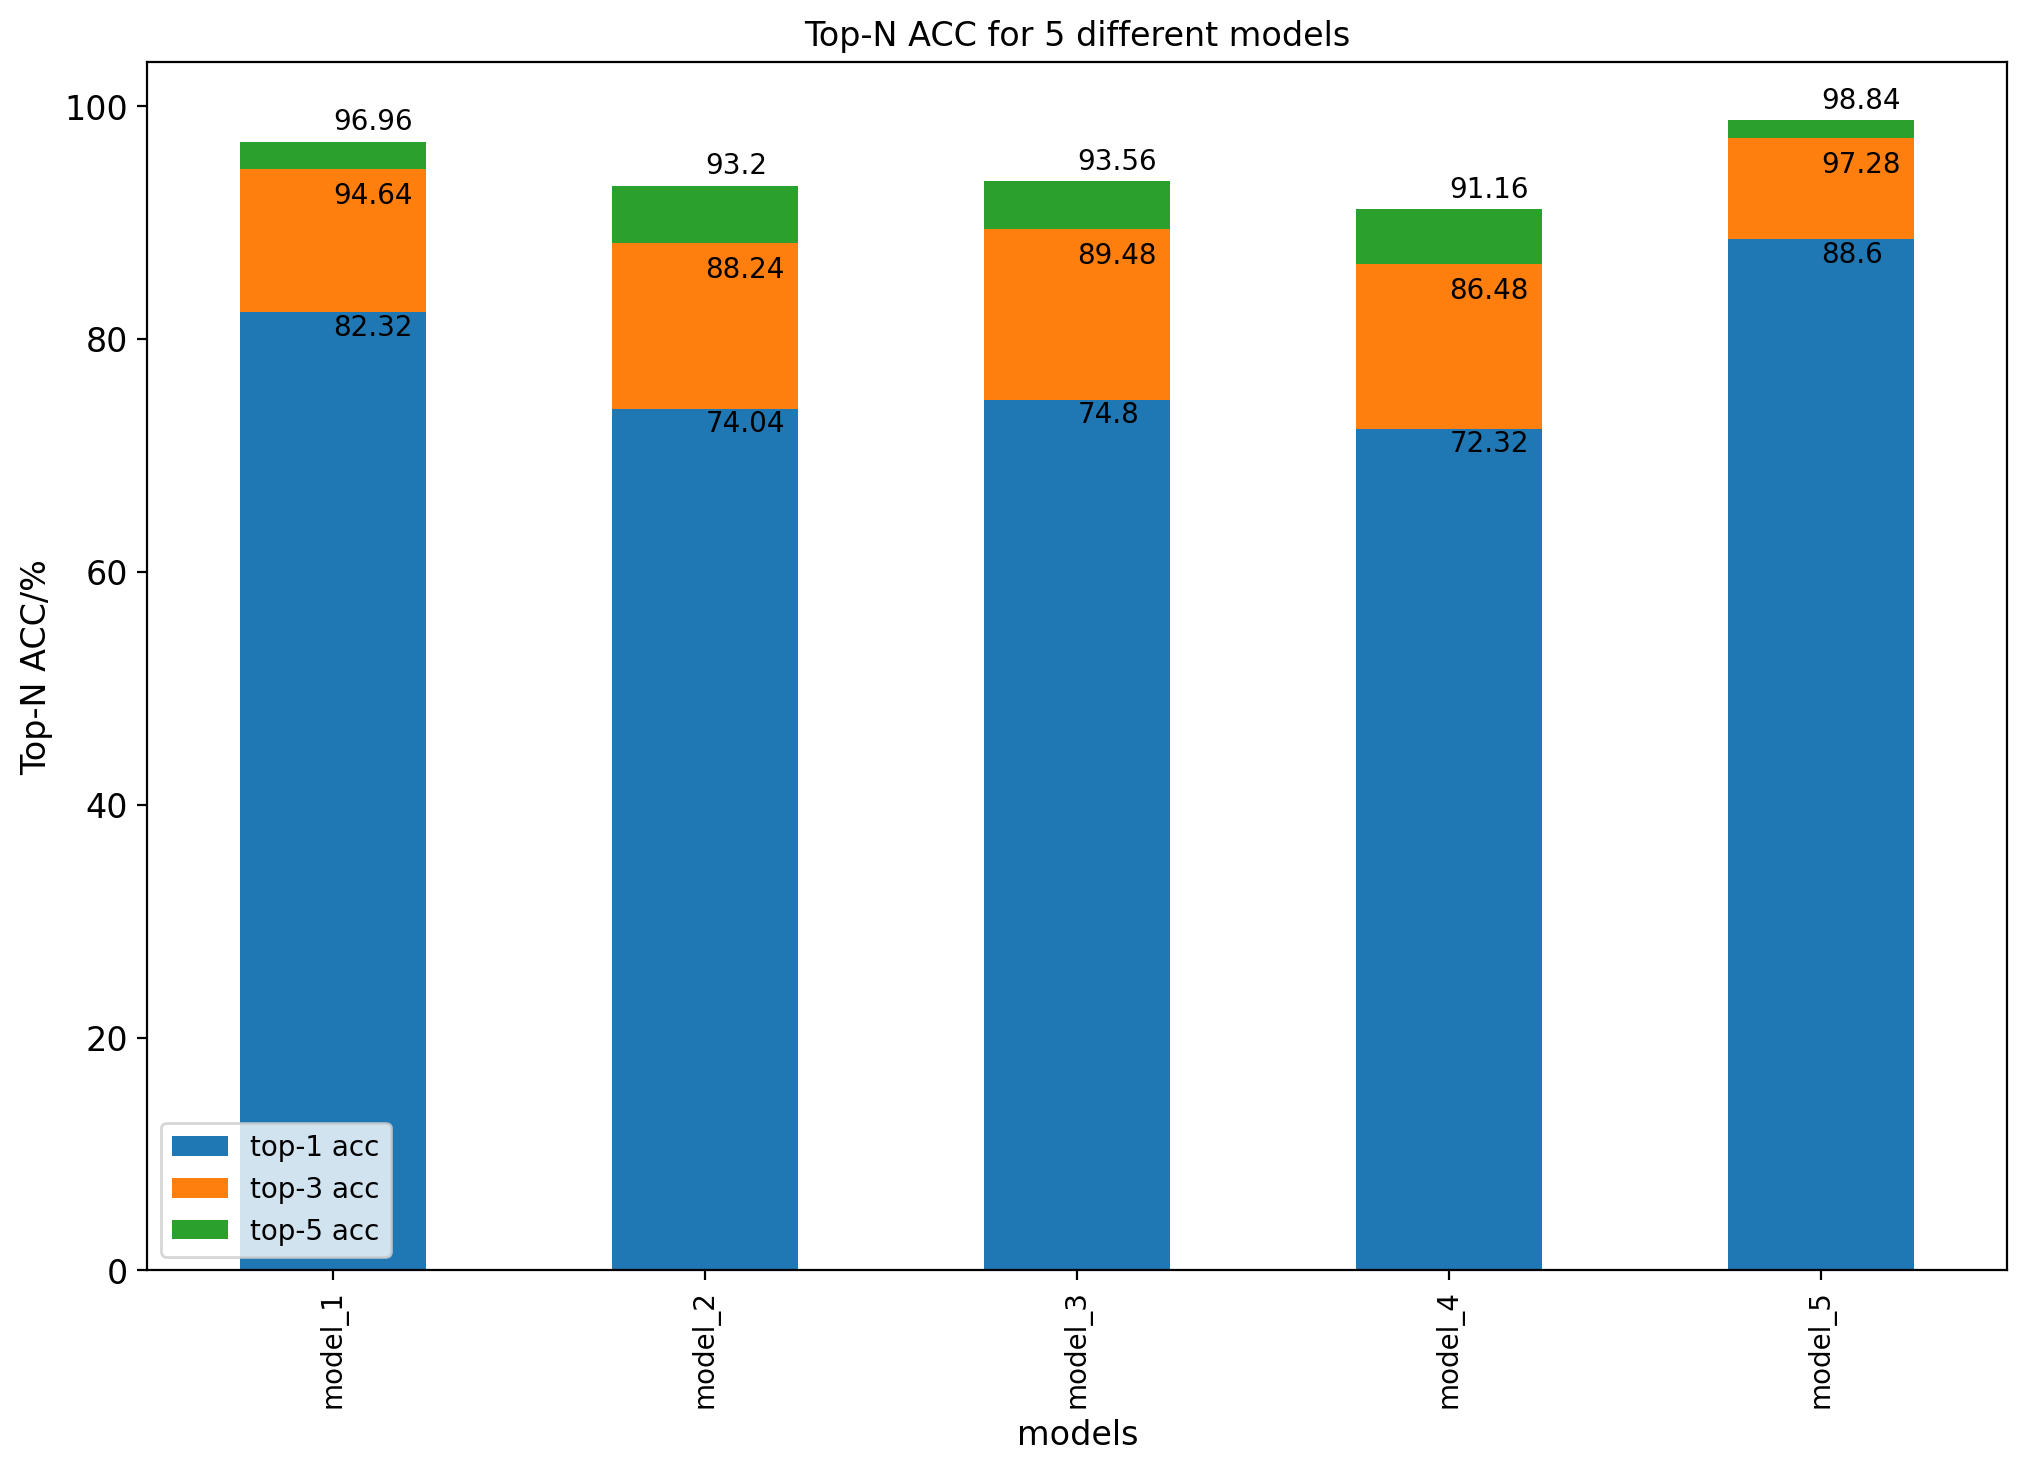
The following image is one of the bar graphs in the acticle.
-
Notifications
You must be signed in to change notification settings - Fork 0
Kopfgeldjaeger/Bar_graph_with_Matplotlib
This commit does not belong to any branch on this repository, and may belong to a fork outside of the repository.
Folders and files
| Name | Name | Last commit message | Last commit date | |
|---|---|---|---|---|
Repository files navigation
About
here is the code for Medium blog: How to draw a bar graph for your scientific paper with python
Resources
Stars
Watchers
Forks
Releases
No releases published
Packages 0
No packages published