parKVFinder Tutorial
On this tutorial, we are going to demonstrate some features of the parKVFinder, including the graphical user interfaces PyMOL2 parKVFinder Tools and PyMOL parKVFinder Tools, and the command-line interface.
All files used on this tutorial can be found under input directory, on the parKVFinder directory.
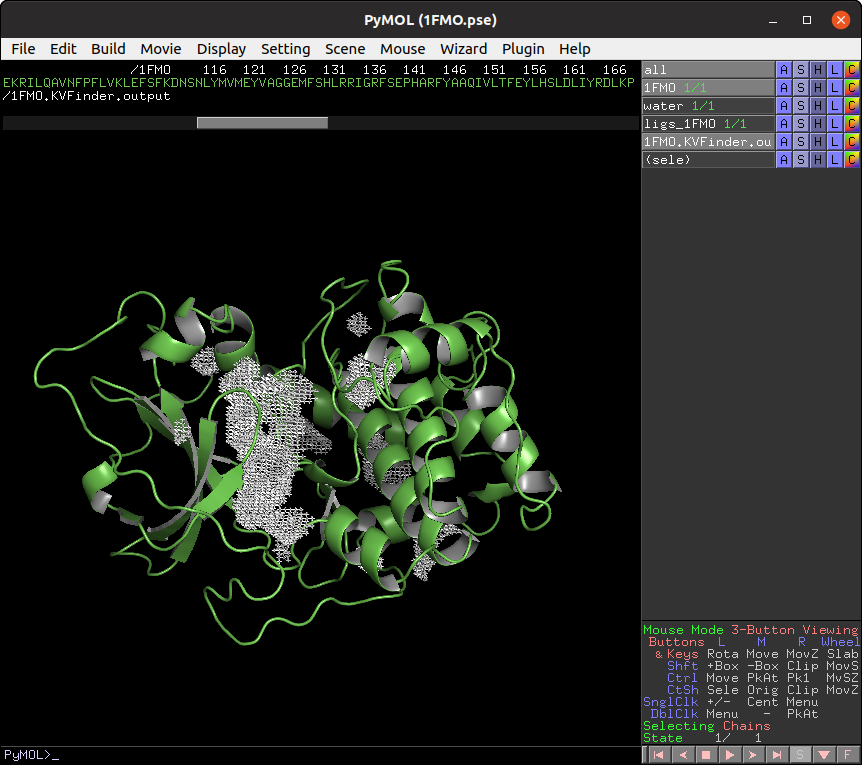
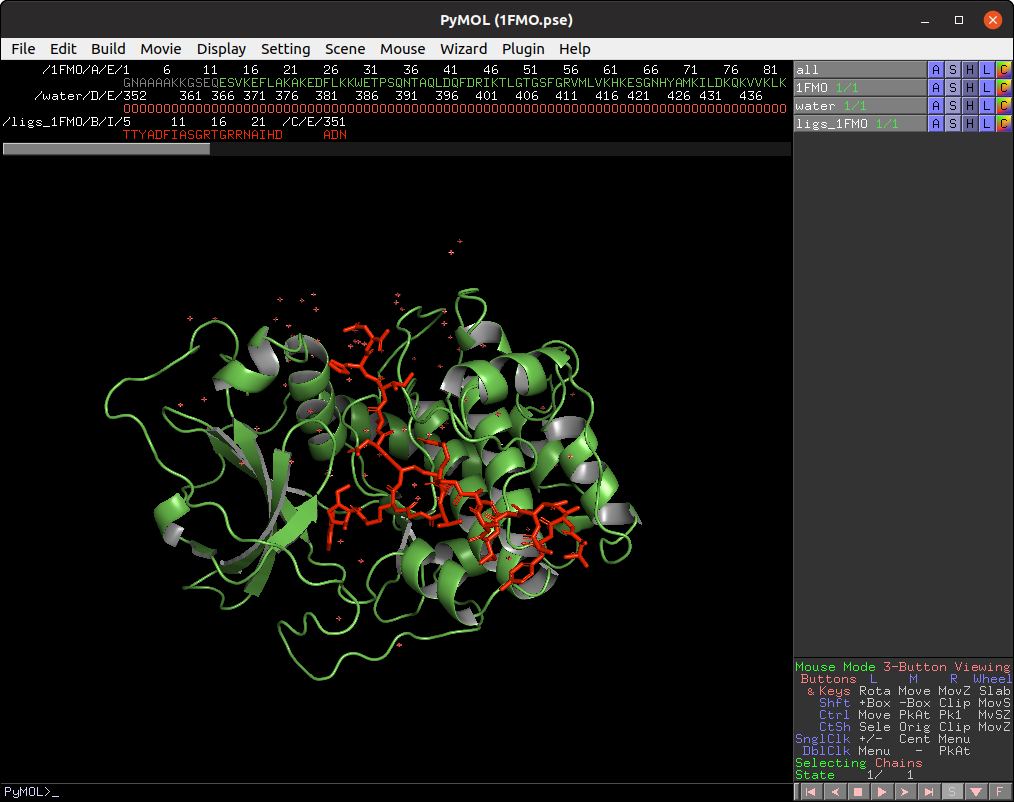
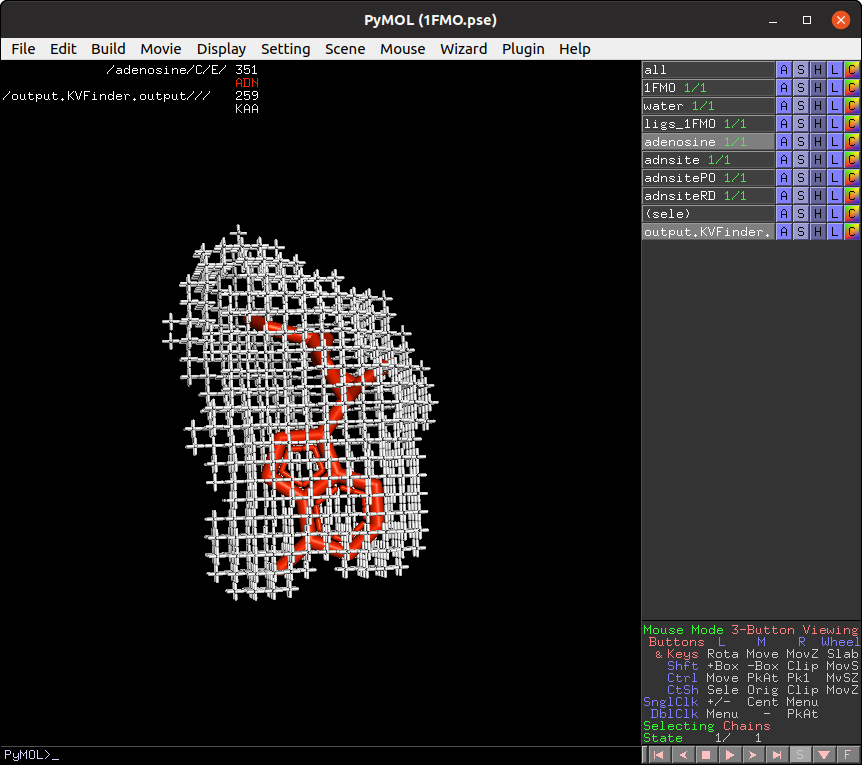
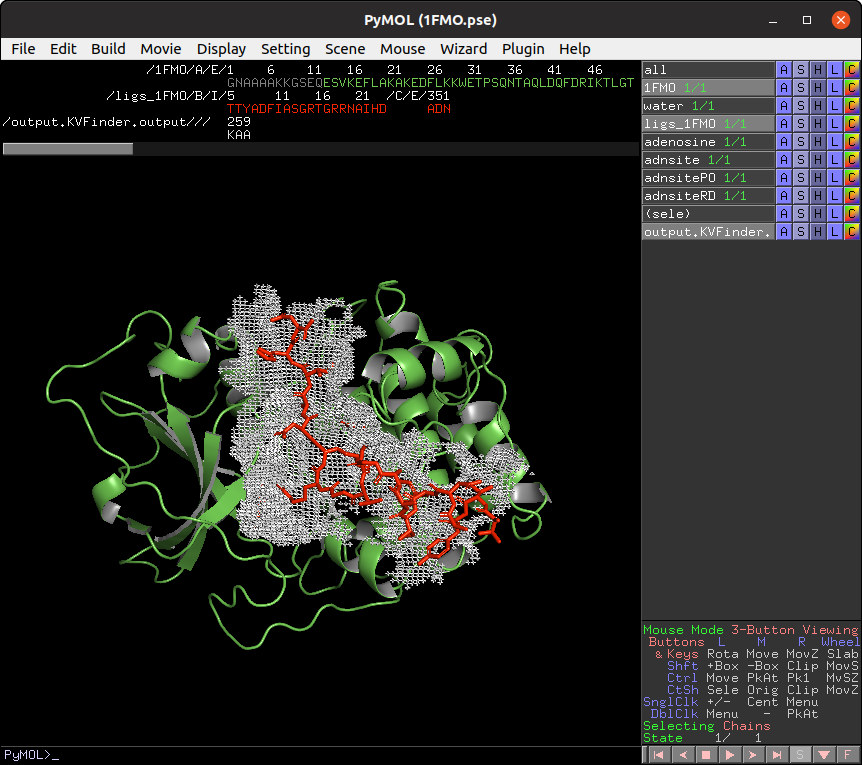
First, load input/1FMO.pse into PyMOL viewer, which loads two objects in your scene. The 1FMO is a subunit of a protein kinase A and the ligs_1FMO is an adenosine (ADN) and a peptide kinase inhibitor (PKI).

The default parameters are designed to make a simple and fast whole protein detection.
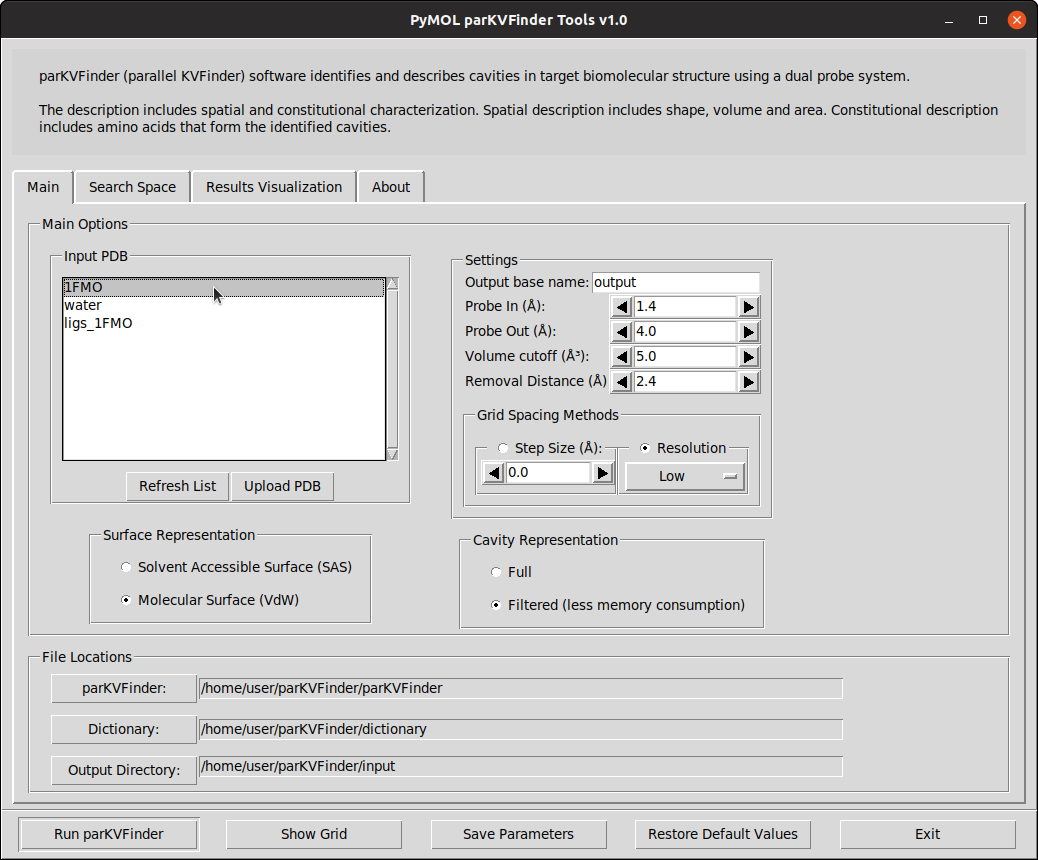
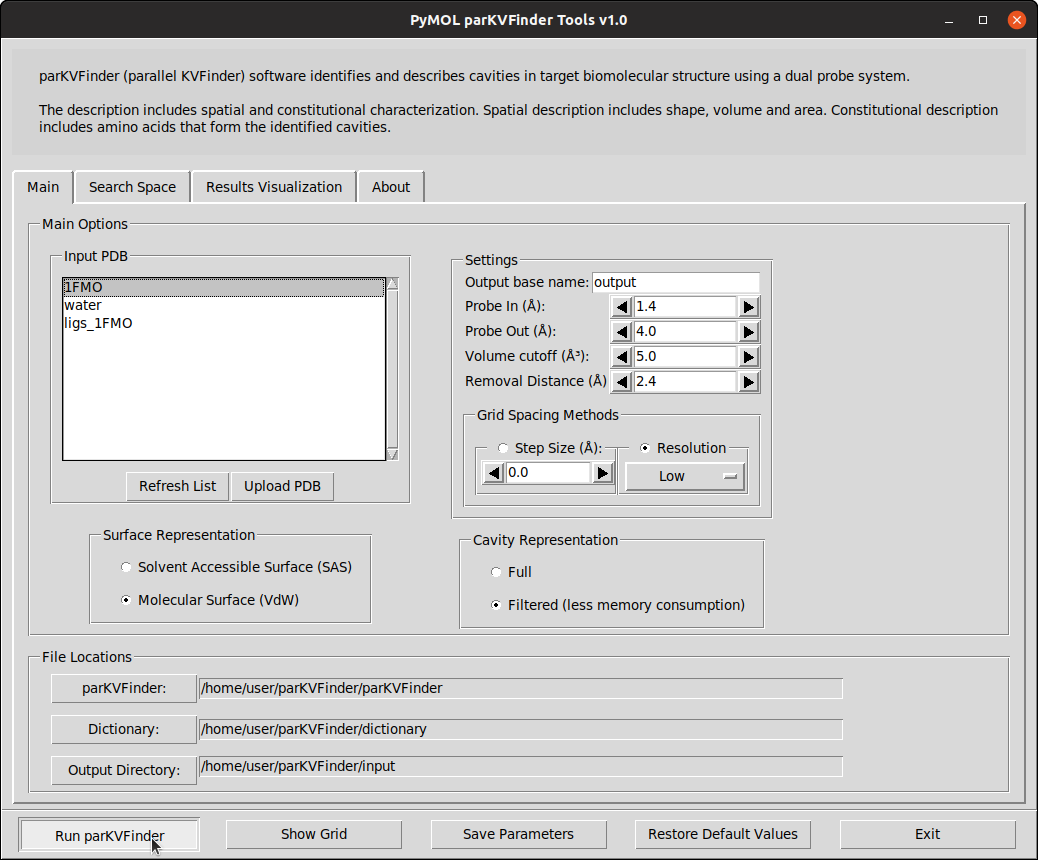
On PyMOL, open PyMOL2 parKVFinder Tools under Plugin tab. The objects on the scene will be listed on the Input PDB combo box, on the Main tab. If not, press the Refresh button.
The Input PDB selection sets which object will be analyzed by parKVFinder. Select 1FMO on the list box.

To run parKVFinder with the default parameters, just click Run parKVFinder button.

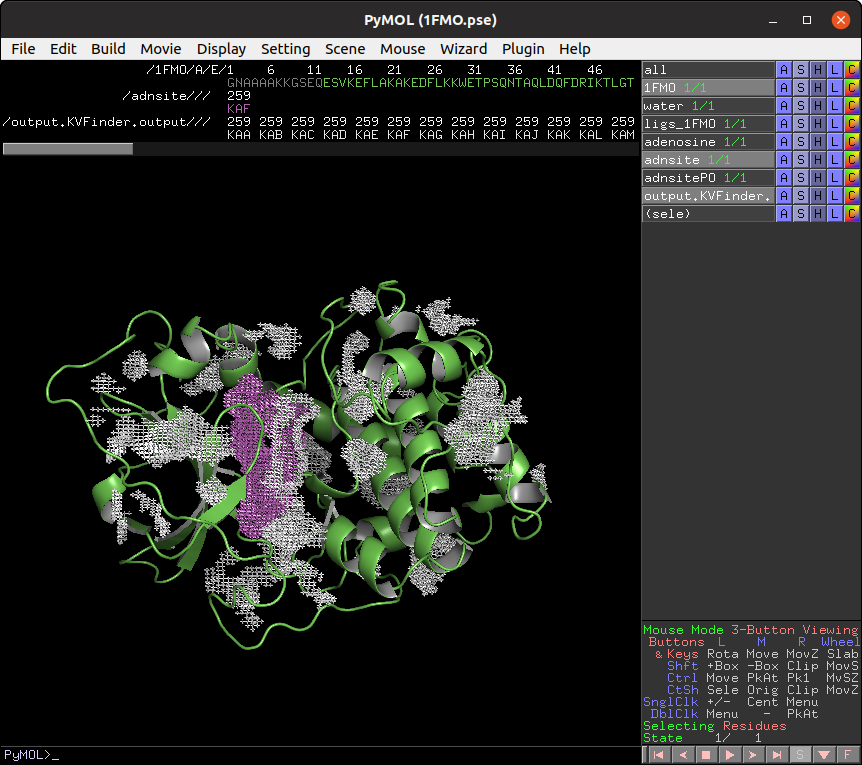
After execution is complete, cavities PDB is loaded into PyMOL viewer as <Output Base Name>.KVFinder.output object and the results file is loaded on the Results tab. In addition, the focus automatically shifts to Results tab.
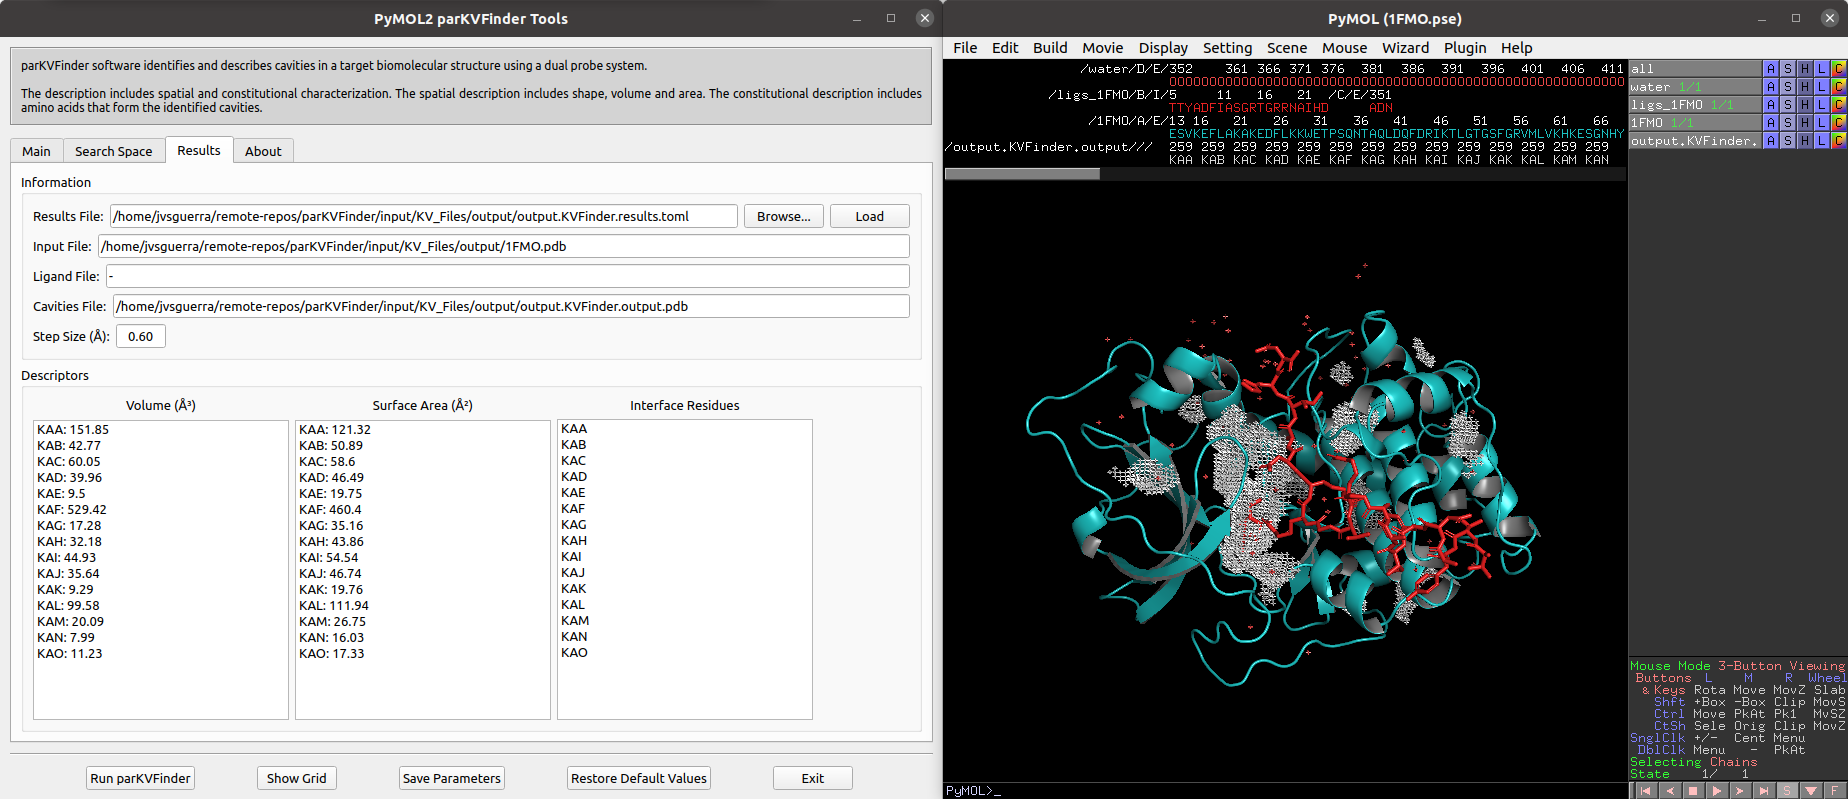
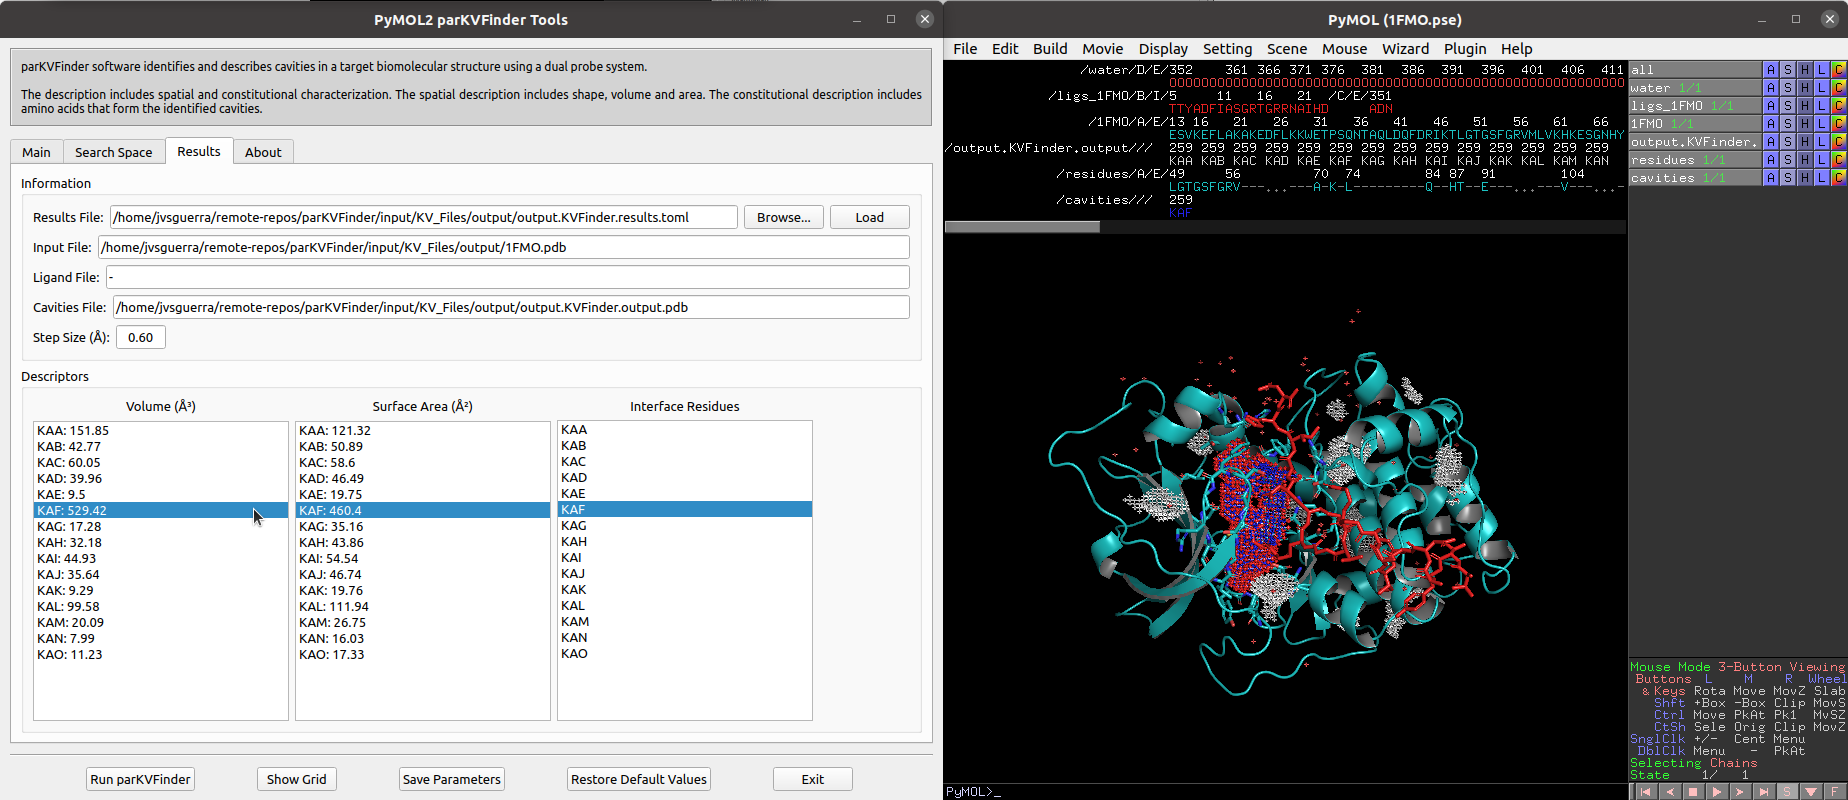
We can select cavities in the Volume or Surface Area lists to highlight them on a new object called cavities, helping to identify each cavity. Also, we can select cavities in the Interface Residues list to highlight the residues around the cavities on a new object named residues.
parKVFinder is all about parameter customization. One of parKVFinder's most powerful assets is the ability to manually set the cavity boundary. parKVFinder works with a double probe system. A smaller probe, called Probe In, and a bigger one, called Probe Out, that defines two molecular surfaces with different molecular accessibility. The space left between these surfaces is considered cavities.
Let’s show the effect of varying Probe Out and Removal Distance on the cavity boundary.
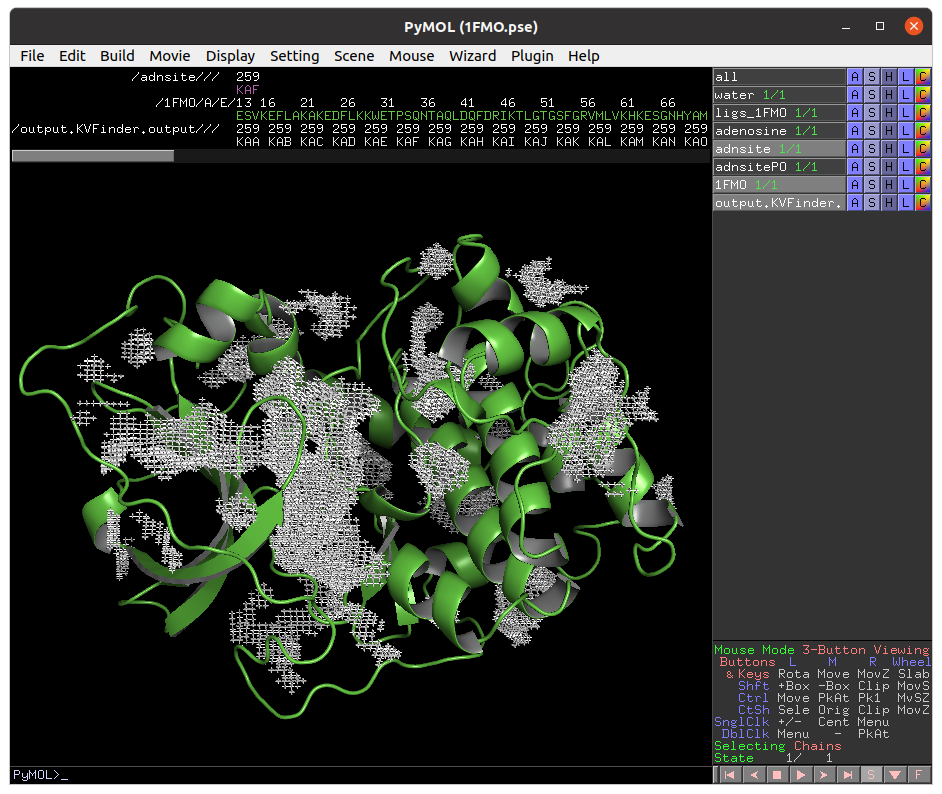
First, we should copy the adenosine to a new object using the following PyMOL commands:
# Copy adenosine
select resn ADN
create adenosine, sele
delete sele
Also, copy the adenosine cavity (KAF) to a new object (adnsite) to compare the cavity boundary from the previous execution.
# Copy adenosine cavity
select resn KAF and output.KVFinder.output
create adnsite, sele
delete sele
Finally, prepare the new PyMOL scene.
# Prepare PyMOL scene
color magenta, adnsite
disable
enable (adnsite, adenosine)

As mentioned above, adjusting the Probe Out size changes the level of the cavity boundary. So let’s go back on the Main tab and change the Probe Out size to 8.0 Å. Run parKVFinder again.

Again, copy the adenosine cavity (KAF) to a new object (adnsitePO).
# Copy new adenosine cavity
select resn KAF and output.KVFinder.output
create adnsitePO, sele
delete sele
Finally, prepare the PyMOL scene.
# Prepare PyMOL scene
disable
enable (adenosine, adnsite, adnsitePO)

Note that the adenosine cavity detected with the 4 Å Probe Out (magenta) has a lower boundary than that detected with the 8 Å probe (white). Therefore, by increasing the size of the Probe Out, the cavity boundary is also raised.
Besides adjusting the Probe Out size, we can also adjust the Removal Distance to change the cavity boundary. So let's go back to the Main tab and change the Removal Distance to 1.2 Å and the size of Probe Out back to 4.0 Å. Run parKVFinder again.
Again, copy the adenosine cavity (KAH) to a new object (adnsiteRD).
# Copy new adenosine cavity
select resn KAH and output.KVFinder.output
create adnsiteRD, sele
delete sele
Finally, prepare the PyMOL scene.
# Prepare PyMOL scene
disable
enable (adenosine, adnsite, adnsiteRD)

Note that the adenosine cavity detected with the 2.4 Å Removal Distance (magenta) has a lower boundary than that detected with the 1.2 Å (white). Therefore, by decreasing the Removal Distance, the cavity boundary is also raised.
Furthermore, changing the cavity boundary by varying Probe Out and Removal Distance also affects cavity segregation.
Note: Usually the Removal Distance adjustment is less time consuming than the Probe Out adjustment for similar effects.
An important feature of parKVFinder is the steered detection of cavities. We continue our tutorial illustrating two distinct methods of cavity segmentation.
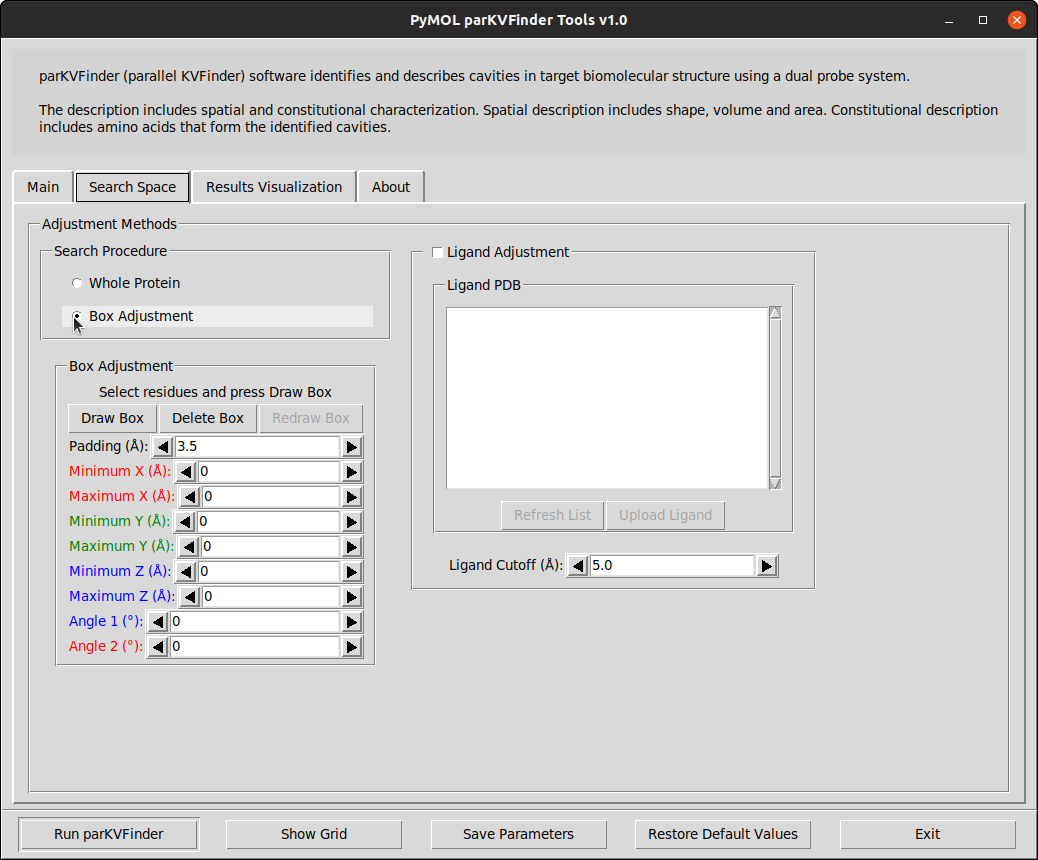
Box adjustment mode explores closed regions with a custom box, which can be drawn via the GUI.
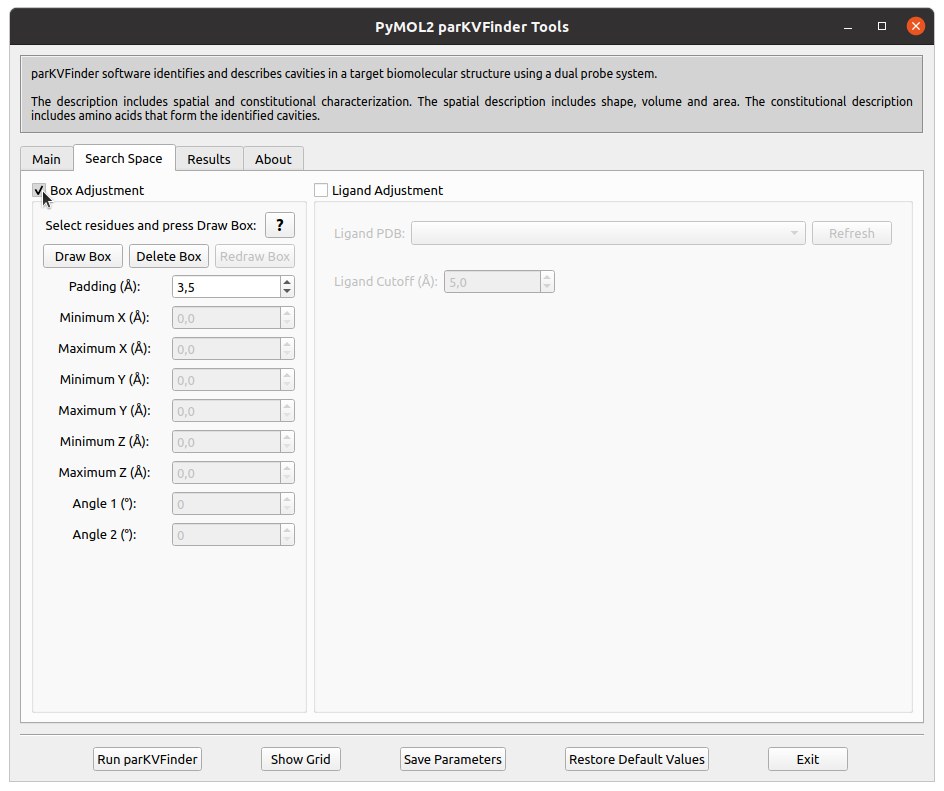
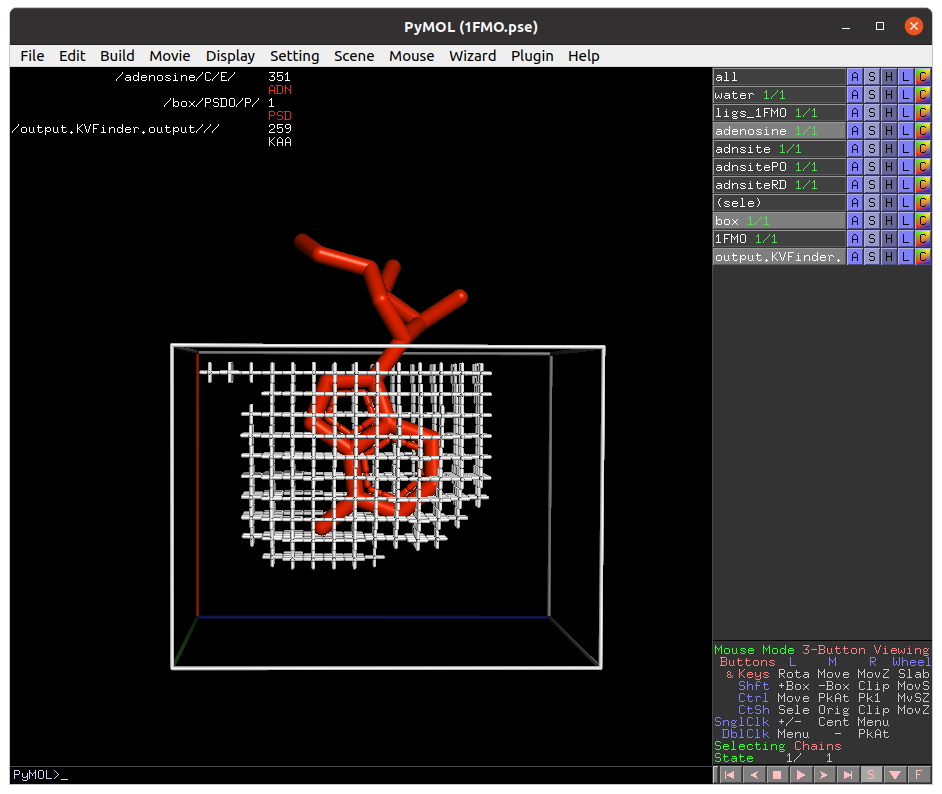
On the Search Space tab, select Box Adjustment check box. This will enable a Box Adjustment frame, which handles the custom box in PyMOL viewer.
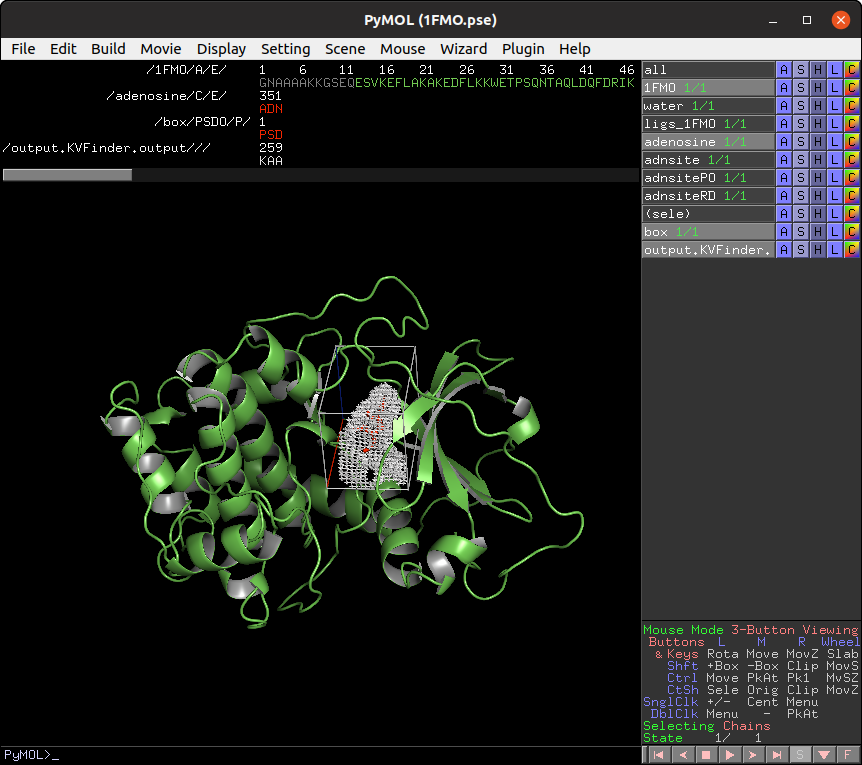
The custom box is drawn based on the (sele) object in the PyMOL viewer.
Then, select the adenosine ligand. This can be made on the PyMOL viewer
by clicking on the ligand structure or using select resn ADN PyMOL
command.
Click on Draw Box Button. This will create a custom box that limits the search space. It is fully customizable, but we will not change it for now.

On the Main tab, change Removal Distance back to 2.4 Å and rerun parKVFinder.

Now, let's customize the box parameters to segment the binding site of our target protein.
Each axis is associated with one color (red with X, green with Y and blue with Z). The adjustment is made by the arrows or directly setting the value in the entry on the Search Space tab in the Box Adjustment group. We can also adjust the box angles by the same procedure. After altering the values, just click on Redraw Box button to redraw the box object using the new values.
Then, on the Search Space tab, reduce Maximum X to 1.0 Å and click Redraw Box. Rerun parKVFinder.
Lastly, click on Delete Box button to delete the custom box.
A last feature is to limit the search around a structure. In this last example, let's do a whole protein prospection again, but limiting the search space around ligands.
First, on the Search Space tab, deselect Box Adjustment checkbox, which will disable the previous enabled Box Adjustment frame.
Still on the Search Space tab, click on the check button Ligand Adjustment, which will enable the Refresh button, the Ligand PDB combo box and the Ligand Cutoff entry.
Click the Refresh button to display all objects in the scene in the Ligand PDB combo box. Select the adenosine on the combo box and reduce Ligand Cutoff to 3.0 Å. Run parKVFinder again.

Now, let's shift focus to the two ligands (adenosine and PKI) in the ligs_1FMO object.
On the Search Space tab, select the ligs_1FMO on the Ligand PDB combo box and increase Ligand Cutoff back to 5.0 Å. Back on the Main tab, increase Probe Out to 10.0 Å and reduce Removal Distance to 0.0 Å. Run parKVFinder again.

First, load input/1FMO.pse into PyMOL viewer, which loads two objects in your scene. The 1FMO is a subunit of a protein kinase A and the ligs_1FMO is an adenosine (ADN) and a peptide kinase inhibitor (PKI).
The default parameters are designed to make a simple and fast whole protein detection.
On PyMOL, open PyMOL parKVFinder Tools under Plugin tab. The objects on the scene will be listed on the Input PDB list box, on the Main tab. If not, press the Refresh List
The Input PDB selection sets which object will be analyzed by parKVFinder. Select 1FMO on the list box.
To run parKVFinder with the default parameters, just click Run parKVFinder button or press Enter.
After execution is complete, cavities PDB is loaded into PyMOL viewer as <Output Base Name>.KVFinder.output object and the results file is loaded on the Results Visualization tab. In addition, the focus automatically shifts to Results Visualization tab.

We can select cavities in the Volume or Surface Area lists to highlight them on a new object called cavities, helping to identify each cavity. Also, we can select cavities in the Interface Residues list to highlight the residues around the cavities on a new object named residues.

parKVFinder is all about parameter customization. One of parKVFinder's most powerful assets is the ability to manually set the cavity boundary. parKVFinder works with a double probe system. A smaller probe, called Probe In, and a bigger one, called Probe Out, that defines two molecular surfaces with different molecular accessibility. The space left between these surfaces is considered cavities.
Let’s show the effect of varying Probe Out and Removal Distance on the cavity boundary.
First, we should copy the adenosine to a new object using the following PyMOL commands:
# Copy adenosine
select resn ADN
create adenosine, sele
delete sele
Also, copy the adenosine cavity (KAF) to a new object (adnsite) to compare the cavity boundary from the previous execution.
# Copy adenosine cavity
select resn KAF and output.KVFinder.output
create adnsite, sele
delete sele
Finally, prepare the new PyMOL scene.
# Prepare PyMOL scene
color magenta, adnsite
disable
enable (adnsite, adenosine)

As mentioned above, adjusting the Probe Out size changes the level of the cavity boundary. So let’s go back on the Main tab and change the Probe Out size to 8.0 Å. Run parKVFinder again.

Again, copy the adenosine cavity (KAF) to a new object (adnsitePO).
# Copy new adenosine cavity
select resn KAF and output.KVFinder.output
create adnsitePO, sele
delete sele
Finally, prepare the PyMOL scene.
# Prepare PyMOL scene
disable
enable (adenosine, adnsite, adnsitePO)

Note that the adenosine cavity detected with the 4 Å Probe Out (magenta) has a lower boundary than that detected with the 8 Å probe (white). Therefore, by increasing the size of the Probe Out, the cavity boundary is also raised.
Besides adjusting the Probe Out size, we can also adjust the Removal Distance to change the cavity boundary. So let's go back to the Main tab and change the Removal Distance to 1.2 Å and the size of Probe Out back to 4.0 Å. Run parKVFinder again.
Again, copy the adenosine cavity (KAH) to a new object (adnsiteRD).
# Copy new adenosine cavity
select resn KAH and output.KVFinder.output
create adnsiteRD, sele
delete sele
Finally, prepare the PyMOL scene.
# Prepare PyMOL scene
disable
enable (adenosine, adnsite, adnsiteRD)

Note that the adenosine cavity detected with the 2.4 Å Removal Distance (magenta) has a lower boundary than that detected with the 1.2 Å (white). Therefore, by decreasing the Removal Distance, the cavity boundary is also raised.
Furthermore, changing the cavity boundary by varying Probe Out and Removal Distance also affects cavity segregation.
Note: Usually the Removal Distance adjustment is less time consuming than the Probe Out adjustment for similar effects.
An important feature of parKVFinder is the steered detection of cavities. We continue our tutorial illustrating two distinct methods of cavity segmentation.
Box adjustment mode explores closed regions with a custom box, which can be drawn via the GUI.
On the Search Space tab, select Box Adjustment option under Search Procedure group. This will enable a Box Adjustment frame, which handles the custom box in PyMOL viewer.
The custom box is drawn based on the (sele) object in the PyMOL viewer.
Then, select the adenosine ligand. This can be made on the PyMOL viewer
by clicking on the ligand structure or using select resn ADN PyMOL
command.
Click on Draw Box Button. This will create a custom box that limits the search space. It is fully customizable, but we will not change it for now.

On the Main tab, change Removal Distance back to 2.4 Å and rerun parKVFinder.
Now, let's customize the box parameters to segment the binding site of our target protein.
Each axis is associated with one color (red with X, green with Y and blue with Z). The adjustment is made by the arrows or directly setting the value in the entry on the Search Space tab in the Box Adjustment group. We can also adjust the box angles by the same procedure. After altering the values, just click on Redraw Box button to redraw the box object using the new values.
Then, on the Search Space tab, reduce Maximum X to 1.0 Å and click Redraw Box. Rerun parKVFinder.

Lastly, click on Delete Box button to delete the custom box.
A last feature is to limit the search around a structure. In this last example, let's do a whole protein prospection again, but limiting the search space around ligands.
First, on the Search Space tab, select Whole Protein option under Search Procedure group. This will disable the previous enabled Box Adjustment frame.
Still on the Search Space tab, click on the check button Ligand Adjustment. This will enable the buttons Refresh List and Upload Ligand.
Click the Refresh List button to display all objects in the scene in the Ligand PDB list box. Select the adenosine on the list box and reduce Ligand Cutoff to 3.0 Å. Run parKVFinder again.
Now, let's shift focus to the two ligands (adenosine and PKI) in the ligs_1FMO object.
On the Search Space tab, select the ligs_1FMO on the Ligand PDB list box and increase Ligand Cutoff back to 5.0 Å. Back on the Main tab, increase Probe Out to 10.0 Å and reduce Removal Distance to 0.0 Å. Run parKVFinder again.
parKVFinder has a command-line interface, which can be useful for molecular dynamics and high-throughput analysis. It also handles the same parameters available in PyMOL2 parKVFinder Tools and PyMOL parKVFinder Tools, except for box rotations in box adjustment mode.
/home/user/parKVFinder$ parKVFinder
parKVFinder (parallel KVFinder) software identifies and describes cavities in
target biomolecular structure using a dual probe system.

The description includes spatial and constitutional characterization. Spatial
description includes shape, volume and area. Constitutional description includes
amino acids that form the identified cavities.

Usage: parKVFinder <.pdb> [options],
	where PDB is a path to a target PDB file.

Options:
  -h, --help
	  Display this help message.
  -v, --version
	  Display parKVFinder version.
  --verbose
	  Print extra information to stdout.
Note: If you are using parKVFinder for Windows (parKVFinder-win) version, instead of invoking the CLI using parKVFinder command, you must use %KVFinder_PATH%\parKVFinder-win64.exe command.
Standard execution of the command line interface only requires the PDB file path of the target protein. So let's repeat the execution of 1FMO protein with default parameters.
/home/user/parKVFinder$ parKVFinder$ parKVFinder input/1FMO.pdb
[PID 8504] Running parKVFinder for: /home/user/parKVFinder/input/1FMO.pdb
done!
Elapsed time: 0.78 seconds
To view the cavities, the cavities PDB file must be loaded into PyMOL.

There a set of options for customizing parKVFinder's command line execution. These options are displayed in a help menu with their default values when applicable.
/home/user/parKVFinder$ parKVFinder$ parKVFinder -h
================================================================================
============================= parKVFinder help menu ============================
parKVFinder (parallel KVFinder) software identifies and describes cavities in
target biomolecular structure using a dual probe system.

The description includes spatial and constitutional characterization. Spatial
description includes shape, volume and area. Constitutional description includes
amino acids that form the identified cavities.

Usage: parKVFinder <.pdb> [options],
	where PDB is a path to a target PDB file.

Options:
  -h, --help
	  Display this help message.
  -v, --version
	  Display parKVFinder version.
  --verbose
	  Print extra information to stdout.

General options:
  -p, --parameters	[<.toml>]
	  Define path to parameters file.
  -d, --dictionary	[<dictionary>]
	  Define path to a custom dictionary file.
  -r, --resolution	<enum>		(Low)
	  Define resolution mode. Options include: Off, Low, Medium and High.
  -s, --step		<real>		(0.0)
	  Define step size (grid spacing).
  -i, --probe_in	<real>		(1.4)
	  Define probe in size.
  -o, --probe_out	<real>		(4.0)
	  Define probe out size.
  --volume_cutoff	<real>		(5.0)
	  Define cavities volume filter.
  --removal_distance	<real>		(2.4)
	  Define removal distance when comparing probes surfaces.
  -t, --template			(paramters.toml)
	  Create a parameter file template with defined parameters in current
	  working directory.

Box adjustment options:
  -B, --box
	  Define a search box mode where parKVFinder will detect cavities.
  --custom_box		[<file>]
	  Define a custom search box based on a file containing the minimum and
	  maximum cartesian values of each axis in angstrom.
  --residues_box	[<file>]
	  Automatically set a search box based a file containing a tab-separated
	  list of residues.
  --padding		<real>		(3.5)
	  Define residues box padding. Adds a length in each box direction.

Surface options:
  -S, --surface		<enum>		(VdW)
	  Define a surface representation. Options include: SAS and VdW. SAS
	  specifies solvent accessible surface. VdW specifies van der Waals
	  molecular surface.

Ligand options:
  -L, --ligand		[<.pdb>]
	  Define path to ligand PDB file.
  --ligand_cutoff	<real>		(5.0)
	  Define ligand radius distance cutoff.

================================================================================
================================================================================
So let's repeat the previous analysis, but changing Probe Out and Volume Cutoff parameters.
/home/user/parKVFinder$ parKVFinder$ parKVFinder input/1FMO.pdb --probe_out 8.0
--volume_cutoff 100.0
[PID 12089] Running parKVFinder for: /home/user/parKVFinder/input/1FMO.pdb
done!
Elapsed time: 1.99 seconds
If we set the verbose flag, extra information will be printed in stdout.
/home/user/parKVFinder$ parKVFinder$ parKVFinder input/1FMO.pdb --probe_out 8.0
--volume_cutoff 100.0 --verbose
[PID 12198] Running parKVFinder for: /home/user/parKVFinder/input/1FMO.pdb
> Setting 'dictionary_name' to default file: /home/user/parKVFinder/dictionary
> Setting 'probe_in' to default value: 1.40
> Setting 'removal_distance' to default value: 2.40
> Setting 'step' (grid spacing) to 0.00.
> Setting 'resolution' to flag: Low
> Setting 'ligand_cutoff' to default value: 5.00
> Chosen 'surface' representation: VdW
> Running parKVFinder for whole biomolecular structure
> Loading atomic dictionary file
> Calculating grid dimensions
> Reading PDB coordinates
> Creating grid
> Filling grid with probe in surface
> Filling grid with probe out surface
> Defining biomolecular cavities
> Calculating volume
> Calculating surface points
> Calculating area
> Retrieving residues surrounding cavities
> Writing cavities PDB file
> Writing results file
done!
Elapsed time: 1.99 secondsThe command line interface takes a different approach to box adjustment mode compared to PyMOL parKVFinder Tools. As the GUI is not available to drawn the custom box, the command line interface set the custom box based on a list of residues (residues_box) or a set of cartesian coordinates (custom_box).
So let's execute parKVFinder using both box approaches.
First, we need to define a list of residues in a tab-separated file, in which we specify the residues as the residues number and chain identifier separated by an underscore character (_).
Considering the example file called 1FMO.residues.KVFinder.in, located inside input directory, we select the residues 51E, 71E, 99E and 134E (highlighted in red) to draw the custom box.

/home/user/parKVFinder$ parKVFinder$ cat input/1FMO.residues.KVFinder.in
51_E	71_E	99_E	134_E
So let's run parKVFinder for the 1FMO protein using a custom box based
on this set of residues. A custom box will be drawn around these
residues with a default padding, which can be changed using the
--padding <real> option.
/home/user/parKVFinder$ parKVFinder$ parKVFinder input/1FMO.pdb -B --residues_box
input/1FMO.residues.KVFinder.in
[PID 15230] Running parKVFinder for: /home/user/parKVFinder/input/1FMO.pdb
done!
Elapsed time: 0.27 seconds
Note: This method uses the same procedure as PyMOL parKVFinder Tools to draw the custom box in Box Adjustment mode.
First, we need to define a tab-separated file containing the minimum and maximum cartesian values of each axis in the following order: Xmin, Xmax, Ymin, Ymax, Zmin and Zmax.
Considering the example file called 1FMO.box.KVFinder.in, located inside input directory, to draw the custom box.
/home/user/parKVFinder$ parKVFinder$ cat input/1FMO.box.KVFinder.in
-20.0	20.0	-20.0	20.0	-20.0	20.0
So let's run parKVFinder for the 1FMO protein using a custom box based on this set of coordinates.
/home/user/parKVFinder$ parKVFinder$ parKVFinder input/1FMO.pdb -B --custom_box
input/1FMO.box.KVFinder.in
[PID 16070] Running parKVFinder for: /home/user/parKVFinder/input/1FMO.pdb
done!
Elapsed time: 0.42 seconds