This plugin is no longer maintained for version 3 of Godot. Link to the plugin for Godot version 4
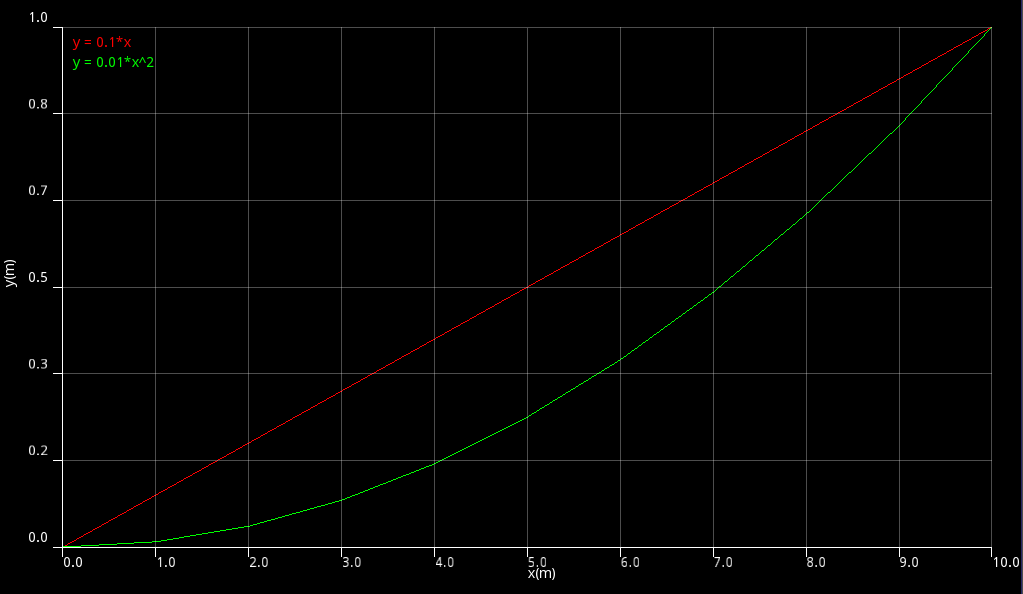
Graph 2D is an addon able to display curves in your user interface in a very simple way.
This repository contains the add-on and examples.
- Plot several curves on the same graph.
- Supports curve thickness and color.
- Customizable chart axes (axis label and grid).
- Real-time plotting.
- Works with both the GLES3 and GLES2 renderers.
- Works on desktop platforms and HTML5 (others target were not tested).
- Create a new scene with a Control type as root node.
- Attach a script to your root node.
- Add a Graph2D node as a child of the root node.
- To create a new curve, call the method
Graph2D.add_curve()from your script. The arguments are in order the name of the curve, its color and finally the thickness of the line.- Note: This method will return an identifier (integer) which will then be used to reference the curve and update its points.
- There are two ways to draw a curve:
- To draw a curve point by point (real-time), you must use the method
Graph2D.add_point(). The arguments are in order the curve identifier and the coordinates of the point (Vector2) - To draw a curve from a set of points, use the method
Graph2D.add_points(). The arguments are in order the curve identifier and a list of points of typePoolVector2Array.
- To draw a curve point by point (real-time), you must use the method
Copyright © 2022 Laurent Dethoor
Unless otherwise specified, files in this repository are licensed under the MIT license. See LICENSE.md for more information.