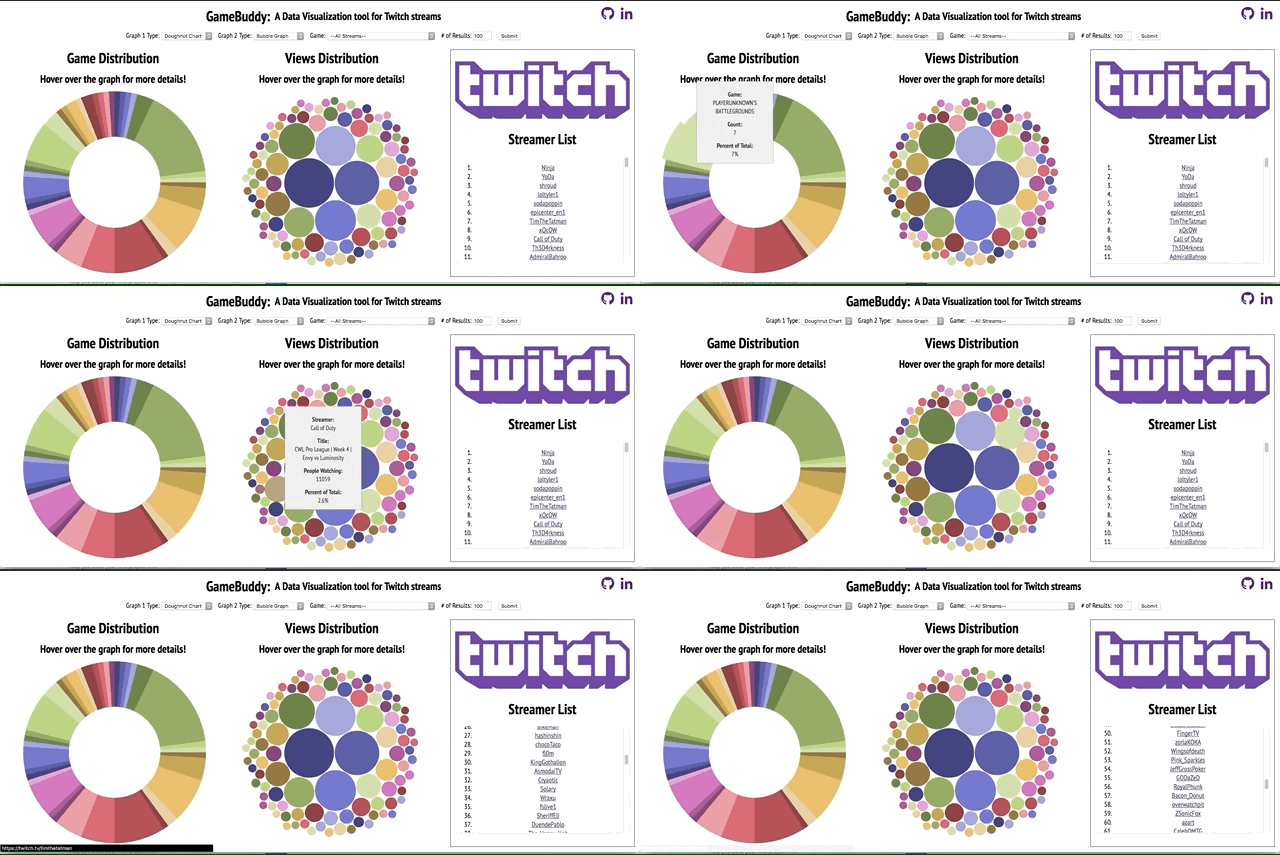
GameBuddy is a data visualization tool that was made in the span of 4 days that displays and gets real-time top streams, their games, and streamers.
Data will be displayed with different types of graphs to be able to compare stats about the games and their viewer counts.
Users will be able to see data distributions for up to 100 different streams.
Additionally, users will be able to:
- Change the amount of streams shown in order to read data better
- Change the game to look at a larger graph of the distribution of that game instead
GameBuddy, users are able to:
- See the top streams
- See the game distribution for the top streams/or the number of followers for the user
- See the viewer distribution for the accounts of the stream
- Specify whether to see the distribution of all streams, or of a specific game from the top streams
- Specify what kind of form they want to see the data in (doughnut graph, bar graph, bubble graph)
Users are able to see the current top streams from the view of the current page. This is done with an event listener on the document. Once the document has loaded it's contents a query is made for 3 requests to the Twitch API which fetch data for the streams. Then the data is manipulated to show certain statistics and put into graphs using D3.js.
The hovers on the graphs are made with a mouse in and out handler along with D3.js in order to create animations for the slice of data being hovered over and a tooltip that displays more data.
  bubbles.on("mouseover", function (d, i) {
    let totalViews = d3.sum(data.map(function (dataObj) {
      return dataObj.viewer_count;
    }));

    let percent = Math.round(1000 * d.data.viewer_count / totalViews) / 10;
    tooltip.select(".streamer").html(`<p>Streamer:</p> ${users[d.data.user_id].displayName}`);
    tooltip.select(".title").html(`<br> <br> ${d.data.title}`);
    tooltip.select(".viewer-count").html(`<p>People Watching:</p> ${d.data.viewer_count}`);
    tooltip.select(".percent").html(`<p>Percent of Total:</p> ${percent}%`);
    tooltip.style("display", "block");
    d3.select(this).select("circle").transition()
      .duration("500")
      .attr("fill-opacity", 0.7)
      .attr("r", d.r + 10);
  });

  bubbles.on("mouseout", function (d) {
    tooltip.style("display", "none");
    d3.select(this).select("circle").transition()
      .duration("500")
      .attr("fill-opacity", 1.0)
      .attr("r", d.r);
});Users are able to change the type of graphs the data is displayed as. This is done by using switch statements on the option selector values of the dropdowns. Depending on what is selected different functions will be called to display the appropriate data.
let formData = new FormData(queryForm);
    for (let [key, value] of formData.entries()) {
      data[key] = value;
    }

    let graph1;
    let graph2;

    switch (data["graph1"]) {
      case "bar":
        graph1 = Graph.makeGameBarGraph;
        break;
      case "pie":
        graph1 = Graph.makeGamePieChart;
        break;
      case "bubble":
        graph1 = Graph.makeGameBubbleGraph;
        break;
    }
The box art changes to the game chosen and the game distribution graph disappears when querying for a specific game. This is to allow for more graph space because the game distribution graph isnt very useful here.
This is done with conditional statements and DOM manipulation.
if (gameId === "all") {
  let gameData = Object.values(results.games);
  newArt.src = "https://upload.wikimedia.org/wikipedia/commons/thumb/c/c6/Twitch_logo_%28wordmark_only%29.svg/1200px-Twitch_logo_%28wordmark_only%29.svg.png";
  document.insertBefore(newArt, newsHeader);
  graph1Container.style.display = "flex";
  graph1(gameData);
  StreamList.makeGameOptions(results.games, results.gameIds);
} else {
  let artSrc = Object.values(results.games)[0].boxArtUrl.replace('-{width}x{height}', '');
  newArt.src = artSrc;
  document.insertBefore(newArt, newsHeader);
  graph1Container.style.display = "none";
}Users are able to see a list of the streamers from their query from the most viewed to the least. This list is created dynamically with vanilla JavaScript and DOM manipulation. The user is able to change how many hits they receive depending on the input for the number of results.
export const makeStreamerList =  (users, userOrder) => {
  const streamList = document.getElementById("stream-list");

  while (streamList.firstChild) {
    streamList.removeChild(streamList.firstChild);
  }

  userOrder.forEach((userId) => {
    if (users[userId].login) {
      let li = document.createElement("li");
      let anchor = document.createElement("a");

      anchor.href = `https://twitch.tv/${users[userId].login}`;
      anchor.target = `_blank`;
      anchor.innerHTML = `${users[userId].displayName}`;

      li.appendChild(anchor);
      streamList.appendChild(li);
    }
  });
};
A similar method is used to grab the game options when choosing all streams.
The project was implemented with the following technologies:
-
Vanilla JavaScript for overall structure and logic.
-
D3.js for data visualization. D3.js was personally very hard to learn and follow, but I decided to challenge myself in trying to learn this and create some beautiful graphs.
-
Webpack to bundle and serve up the various scripts.
-
Twitch API to get data for streams, games, and users.
- Refactoring graph functions to make it more DRY
- Summary of a game when a specific one is chosen by using an API (Possibly MediaWiki API)
- Relevant news links to game or twitch using an API (Possibly Google Custom Search API)
- Getting the application to query continuously with no need for user submittal

