DPG is a model-agnostic tool to provide a global interpretation of tree-based ensemble models, addressing transparency and explainability challenges.
DPG is a graph structure that captures the tree-based ensemble model and learned dataset details, preserving the relations among features, logical decisions, and predictions towards emphasising insightful points. DPG enables graph-based evaluations and the identification of model decisions towards facilitating comparisons between features and their associated values while offering insights into the entire model. DPG provides descriptive metrics that enhance the understanding of the decisions inherent in the model, offering valuable insights.
The concept behind DPG is to convert a generic tree-based ensemble model for classification into a graph, where:
- Nodes represent predicates, i.e., the feature-value associations present in each node of every tree;
- Edges denote the frequency with which these predicates are satisfied during the model training phase by the samples of the dataset.

The graph-based nature of DPG provides significant enhancements in the direction of a complete mapping of the ensemble structure.
| Property | Definition | Utility |
|---|---|---|
| Constraints | The intervals of values for each feature obtained from all predicates connected by a path that culminates in a given class. | Calculate the classification boundary values of each feature associated with each class. |
| Betweenness Centrality | Quantifies the fraction of all the shortest paths between every pair of nodes of the graph passing through the considered node. | Identify potential bottleneck nodes that correspond to crucial decisions. |
| Local Reaching Centrality | Quantifies the proportion of other nodes reachable from the local node through its outgoing edges. | Assess the importance of nodes similarly to feature importance, but enrich the information by encompassing the values associated with features across all decisions. |
| Community | A subset of nodes of the DPG which is characterised by dense interconnections between its elements and sparse connections with the other nodes of the DPG that do not belong to the community. | Understanding the characteristics of nodes to be assigned to a particular community class, identifying predominant predicates, and those that play a marginal role in the classification process. |
| Constraints | Betweenness Centrality | Local Reaching Centrality | Community |
|---|---|---|---|
 |
 |
 |
 |
| Constraints(Class 1) = val3 < F1 ≤ val1, F2 ≤ val2 | BC(F2 ≤ val2) = 4/24 | LRC(F1 ≤ val1) = 6 / 7 | Community(Class 1) = F1 ≤ val1, F2 ≤ val2 |
The library contains two different scripts to apply DPG:
dpg_standard.py: with this script it is possible to test DPG on a standard classification dataset provided bysklearnsuch asiris,digits,wine,breast cancer, anddiabetes.dpg_custom.py: with this script it is possible to apply DPG to your classification dataset, specifying the target class.
Random Forest, an example of a tree-based ensemble model, is already implemented within the scripts used by DPG.
Specifically, the model is within sklearn_standard_dpg.py/sklearn_custom_dpg.py, the scripts used to manage the dataset, train the model, apply DPG, and apply the metrics.
Some Random Forest parameters cannot be modified outside the script where they are defined due to implementation choice.
The library also contains two other essential scripts:
core.pycontains all the functions used to calculate and create the DPG and the metrics.visualizer.pycontains the functions used to manage the visualization of DPG.
The DPG application, through dpg_standard.py or dpg_custom.py, produces several files:
- the visualization of DPG in a dedicated environment, which can be zoomed and saved;
- a
.txtfile containing the DPG metrics; - a
.csvfile containing the information about all the nodes of the DPG and their associated metrics; - a
.txtfile containing the Random Forest statistics (accuracy, confusion matrix, classification report)
Usage: python dpg_standard.py --ds <dataset_name> --l <integer_number> --pv <threshold_value> --t <integer_number> --dir <save_dir_path> --plot --save_plot_dir <save_plot_dir_path> --attribute <attribute> --communities --class_flag
Where:
dsis the name of the standard classificationsklearndataset to be analyzed;lis the number of base learners for the Random Forest;pvis the threshold value indicating the desire to retain only those paths that occur with a frequency exceeding a specified proportion across the trees;tis the decimal precision of each feature;diris the path of the directory to save the files;plotis a store_true variable which can be added to plot the DPG;save_plot_diris path of the directory to save the plot image;attributeis the specific node metric which can be visualized on the DPG;communitiesis a store_true variable which can be added to visualize communities on the DPG;class_flagis a store_true variable which can be added to highlight class nodes.
Disclaimer: attribute and communities can not be added together, since DPG supports just one of the two visualizations.
The usage of dpg_custom.py is similar, but it requires another parameter:
target_column, which is the name of the column to be used as the target variable;- while
dsis the path of the directory where the dataset is.
Some examples can be appreciated in the examples folder: https://github.com/LeonardoArrighi/DPG/tree/main/examples
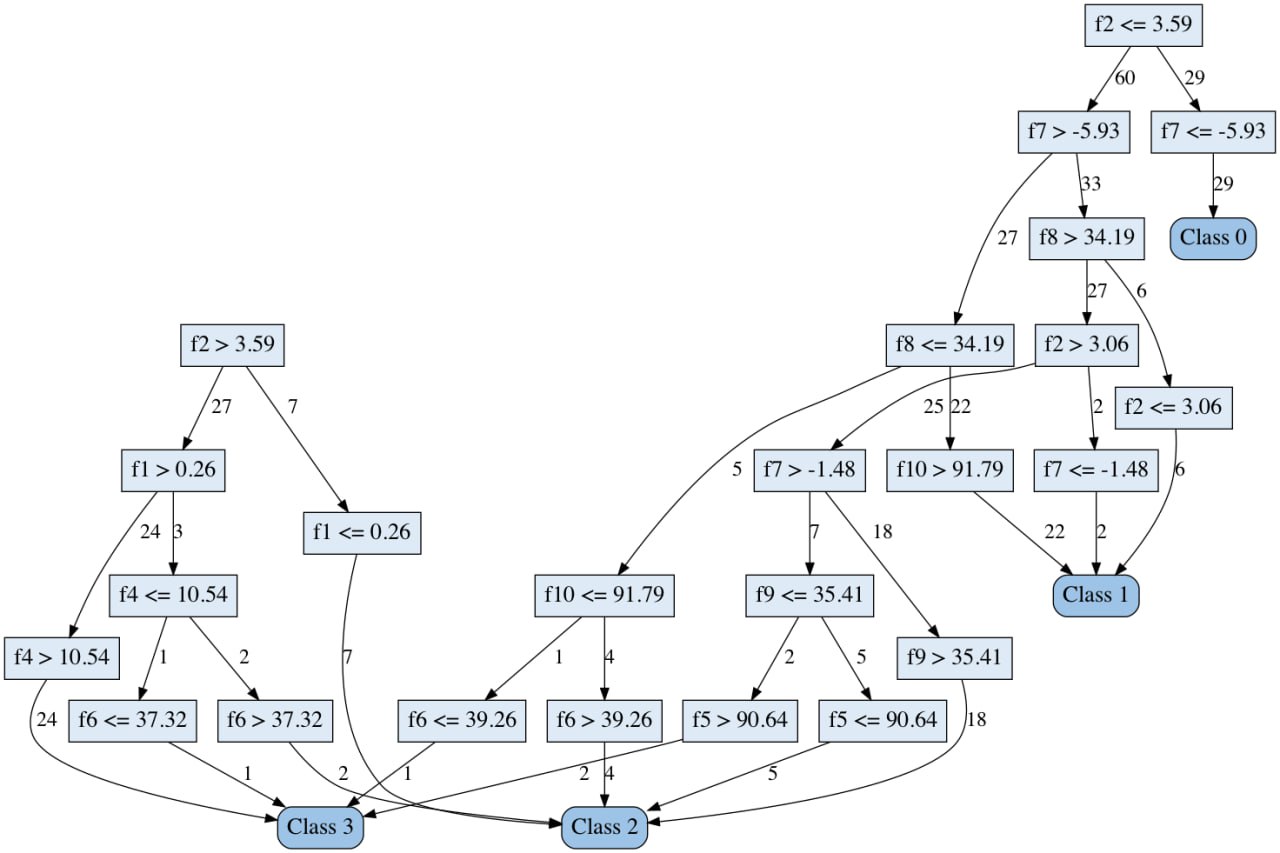
In particular, the following DPG is obtained by transforming a Random Forest with 5 base learners, trained on Iris dataset.
The used command is python --ds iris --l 5 --pv 0.001 --t 2 -- dir examples --plot --save_plot_dir examples.

The following visualizations are obtained using the same parameters as the previous example, but they show two different metrics: Community and Betweenness Centrality.
The used command for showing communities is python --ds iris --l 5 --pv 0.001 --t 2 -- dir examples --plot --save_plot_dir examples --communities.

The used command for showing a specific property is python --ds iris --l 5 --pv 0.001 --t 2 -- dir examples --plot --save_plot_dir examples --attribute "Betweenness Centrality" --class_flag.

If you use this for research, please cite. Here is an example BibTeX entry:
@misc{arrighi2024dpg,
      title={Decision Predicate Graphs: Enhancing Interpretability in Tree Ensembles},
      author={Leonardo Arrighi and Luca Pennella and Gabriel Marques Tavares and Sylvio Barbon Junior},
      year={2024},
      eprint={2404.02942},
      archivePrefix={arXiv},
      primaryClass={cs.LG},
      url={https://arxiv.org/abs/2404.02942},
}