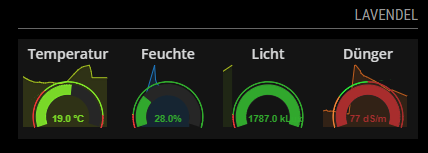
This [MagicMirror²] module allows you to display several gauges in a row generated by grafana.
Important Note: This module requires a running grafana installation. To install Grafana, follow the official installation instructions.
This blogpost describes how to install and use grafana and build a weatherchart.
In your terminal, go to your MagicMirror's Module folder:
cd ~/MagicMirror/modules
Clone this repository:
git clone https://github.com/SvenSommer/MMM-GrafanaGauges
Configure the module in your config.js file.
To use this module, you have to specify where your grafana installation is hosted and which gauges you'd like to display.
Add the module to the modules array in the config/config.js file:
modules: [
{
module: 'MMM-GrafanaGauges',
position: 'top_right', // This can be any of the regions.
header: 'Olive tree',
config: {
host: "grafana_host", //Mandatory. See url when displaying within grafana
port: 3000, // Mandatory.
https: false, // Optional. Consider using TLS for your data. Default: false
dashboardname: "flowers", // Mandatory.
orgId: 1, // Mandatory.
showIDs: [12, 8, 9, 10],// Mandatory. PanelId from the url.
width: "100%", // Optional. Default: 100%
height: "100%", // Optional. Default: 100%
refreshInterval: 900 //Optional. Default: 900 = 1/4 hour
}
},
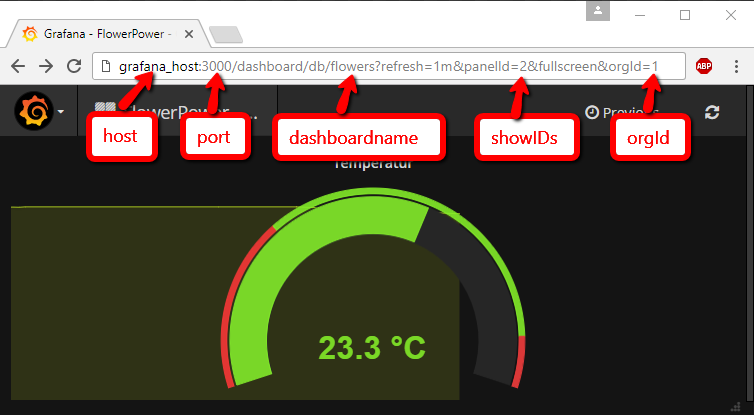
]Everything needed is extractable from the url when you're viewing your gauge using grafana in your browser.
The panelid from each gauges has to be represented within the showIDs-array. Also the order set within this array.
The following properties can be configured:
| Option | Description |
|---|---|
width |
Width of the displayed chart. '150 px' or '50 %' are valid options. Default value: "100%" |
height |
Height of the displayed chart. '150 px' or '50 %' are valid options. Default value: "100%" |
refreshInterval |
Update interval of the diagram in seconds.
Default value: 900 = 15 \* 60 (four times every hour)
|