A Tableau Dashboard project developing and showcasing my skills in building a variety of visualisations and analysis in Tableau. This project looks at employee attrition / reduction in staff numbers and investigates the several variables that may account for this when operating on their own or together such as age, gender, department, job satisfaction, education level, and education field.
- KPIs
- Attrition by Gender
- Department Wise Attrition/ Attrition by Department
- No. of Employees by Age Group
- Job Satisfaction Rating
- Attrition by Education Field
- Attrition Rate by Different Age Groups

Here you can see the visuals change in accordance to the change in figures as filters are applied. Filters can be applied via the education filter st the top of the dashboard or by clicking on segments of the Department Wise Attrition piechart, the green No. of Employees by Age Group vertical barchart, or via the pink Attrition by Education Field horizontal barchart.
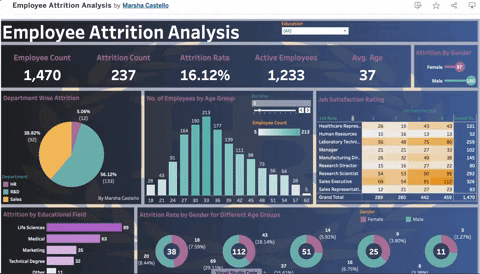
The first visualisation along the top of the dashboard, is a set of KPI's which examines: Employee Count, Atrrition Rate, Active Employee, and Average Age. All of which are susceptible to differences in the education level of employees as shown in the demo below. In this demo, I used the Education filter at the top of the dashboard to filter for differing levels of education.
Filtered to:
- All: Employee Count = 1,470 , Attrition Count = 237 , Attrition Rate = 16.12% , Active Employees= 1,233 and Average Age = 37
- High School: Employee Count = 170 , Attrition Count = 31, Attrition Rate = 18.24% , Active Employees= 139 and Average Age = 32
- Associates Degree: Employee Count = 282, Attrition Count = 44, Attrition Rate = 15.60% , Active Employees= 238 and Average Age = 37
- Bachelor's Degree: Employee Count = 572, Attrition Count = 99, Attrition Rate = 17.31% , Active Employees= 473 and Average Age = 36
- Master's Degree: Employee Count = 398, Attrition Count = 58, Attrition Rate = 14.57% , Active Employees= 340 and Average Age = 39
- Doctoral Degree: Employee Count = 48, Attrition Count = 5, Attrition Rate = 10.42% , Active Employees= 43 and Average Age = 40
From these KPI's we learn that:
- The highest grouping by education falls into the Bachelor Degree grouping, meaning that the majority of Employees are educated to at least Bachelor/Udergraduate degree level (572 = 39%). The average age of this group is 36.
- The lowest number of employees hold a Doctoral degree (48 = 3.3%), the average age for this group is 40.
- At 18.24%, Attrition rate is the highest among those educated to high school level only.
- At 10.42% attrition rate is the lowest among those educated to doctorate degree level.
From this we can deduce that those with the highest level of education are being retained, and this group has an average age of 40. Those that are leaving/ being let go, are those educated to high school age only with an average age of 32.
Click play on the video below:
Employee.KPI.s.2023-01-25.mov
By taking a closer look at the other visualisations, and filtering these, we can build up a better picture of the type of employee being retained versus the type of employee being lost.
Going back to the two groups, we identified, those educated to high school level and those educated to doctoral level we can identify the genders of these groups by filtering the Attrition by Gender visualisation. This visualisation is on the top right of the dashboard.
As shown the group with the highest rate of attrition are educated to only high school level, with an average age of 32. Filtering the lollipop visualisation below, we can see that this group is made up of mostly male. The group with the lowest attrition rate are educated to doctorate level, with an average age of 40 and are mostly female.
Click play on the video below:
Attrition.by.Gender.2023-01-25.mov
From the pie chart below we can see that the Research and Development (R&D) department has the highest attrition percentage of 56.12% as depicted in green. Followed by the sales department, as represented in yellow, with an attrition of 38.82%. The sales department as shown in pink, has the lowest attrition rate of 12%.
