
Tableau Dashboard Covid 19 Vaccination Tracker which explores what share of the global population had been been either partially or fully vaccinated, during the set time period of 4 Sept 2020 to 25 Oct 2021


- Filters Start date, end date, continent and country
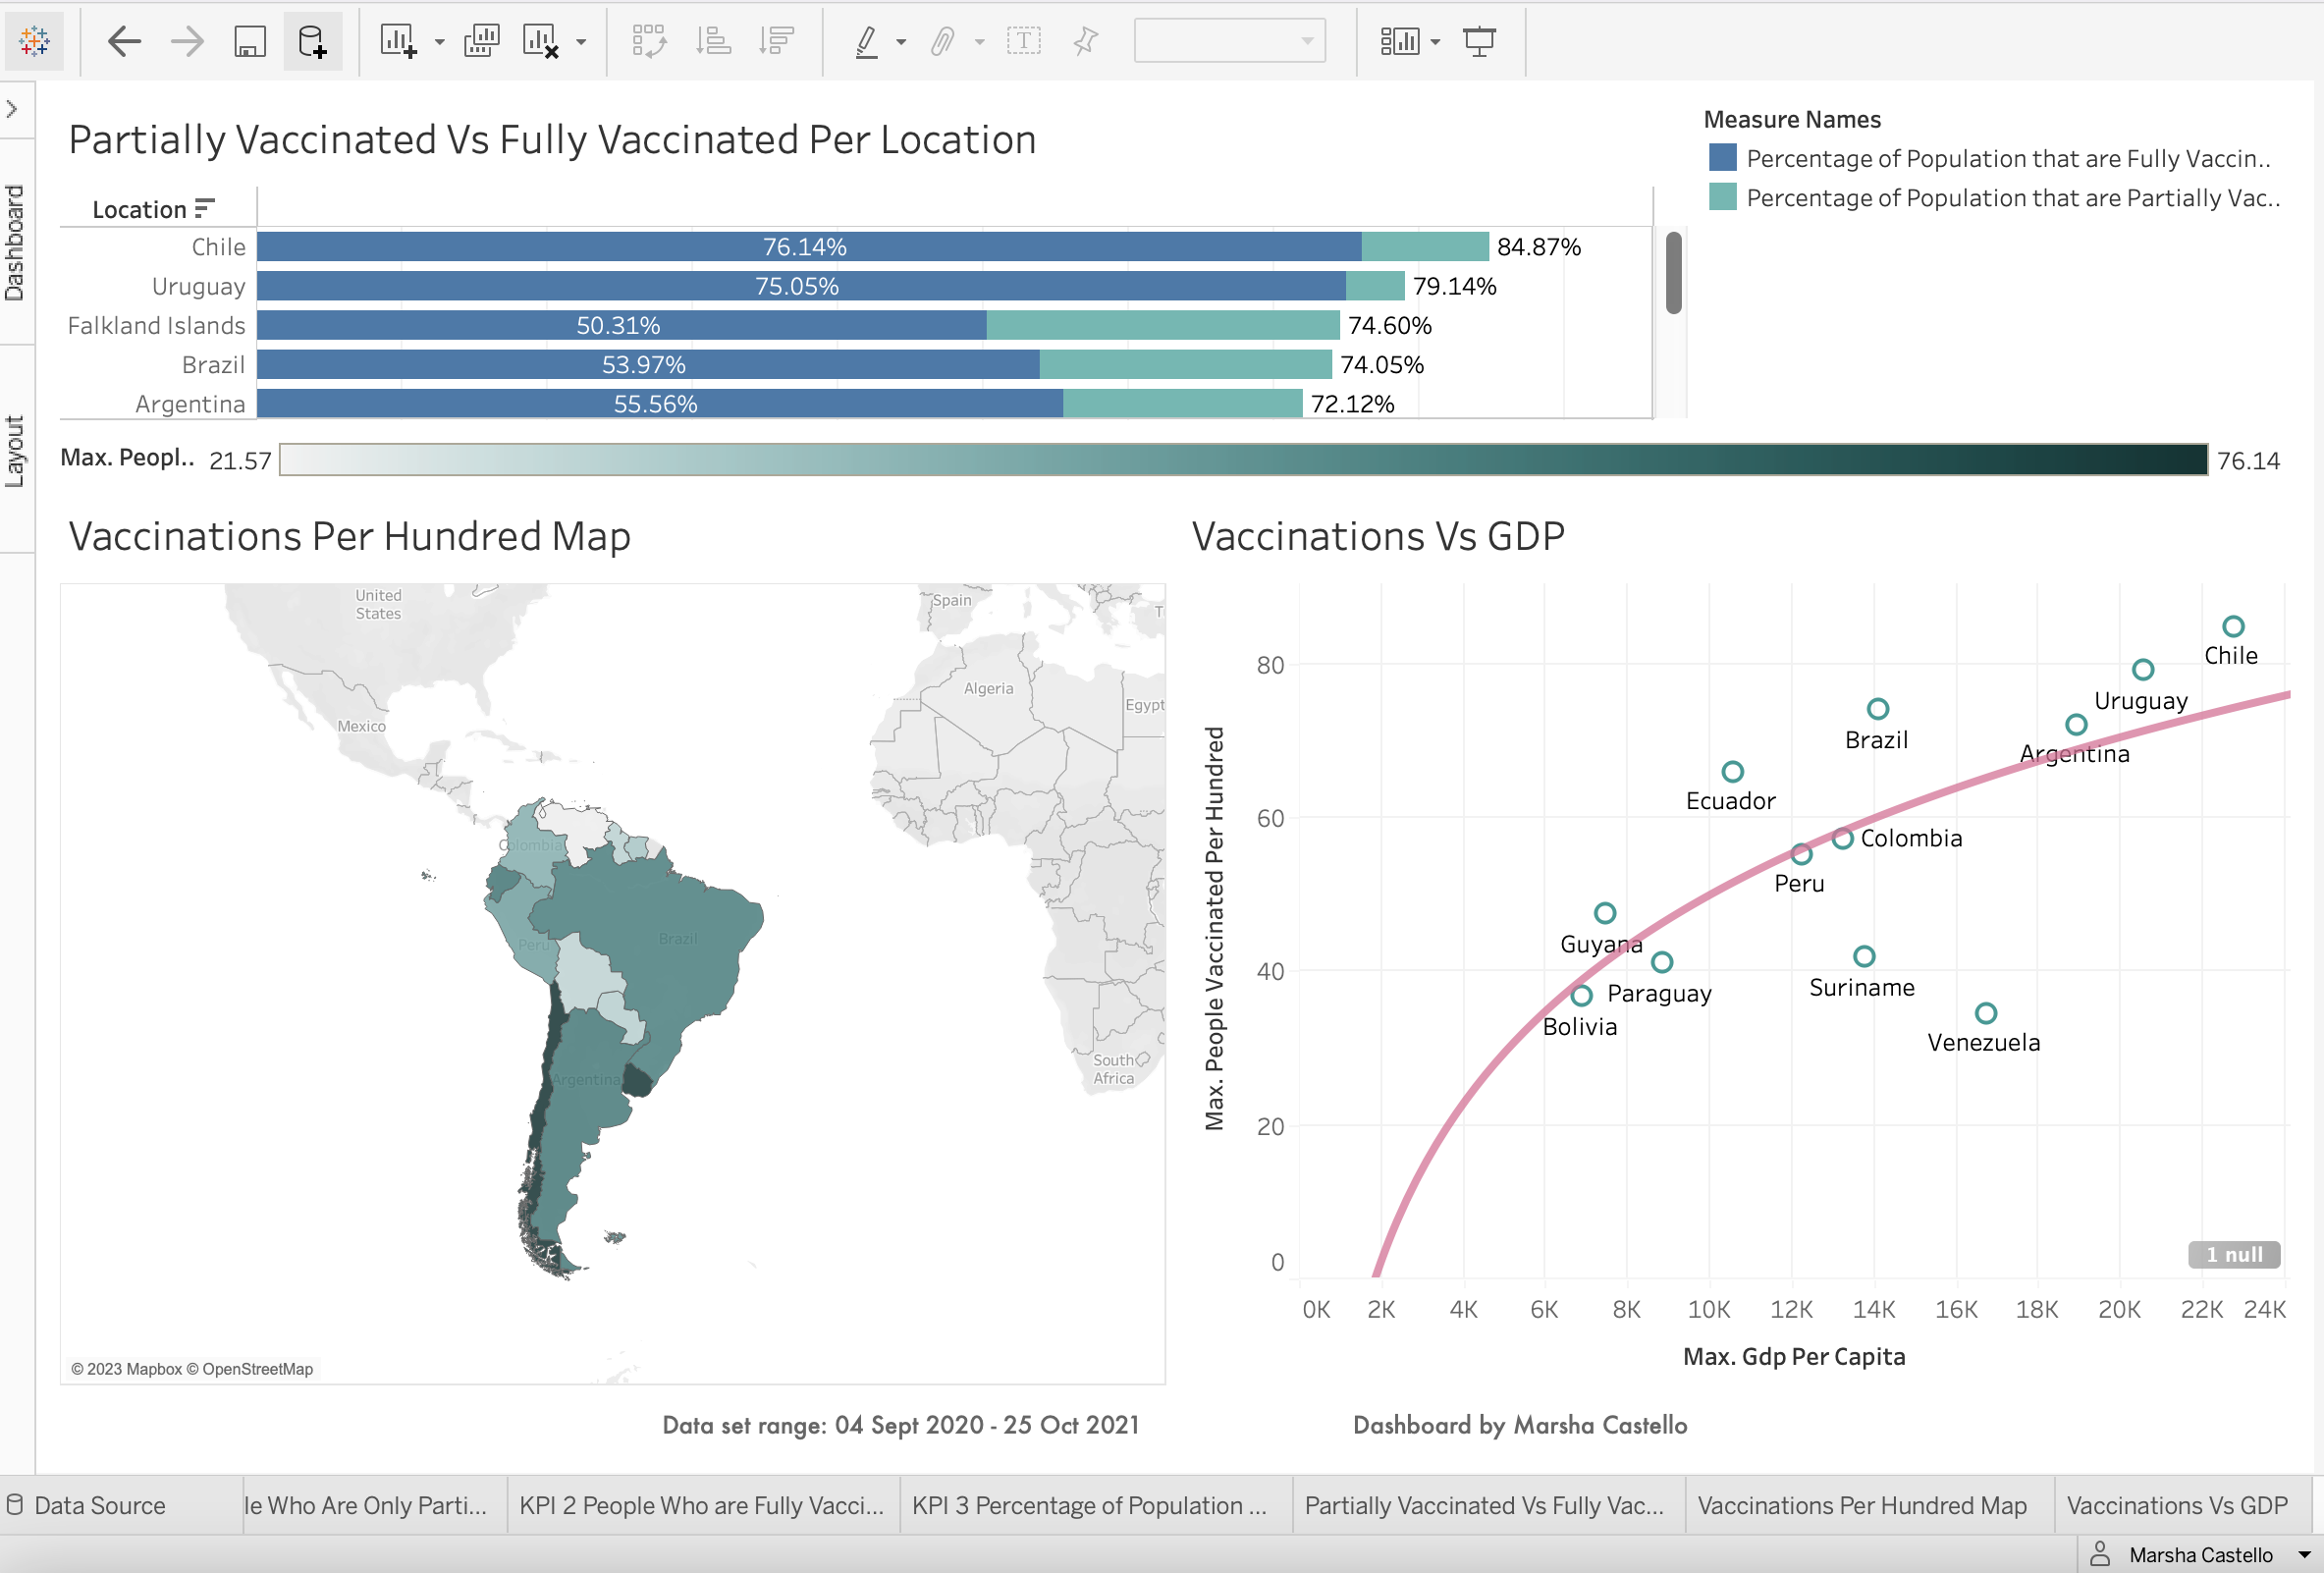
- Stacked Bar Chart Partially Vaccinated (Green) vs Fully Vaccinated(Blue) Per Location
- Global Map Geographical Vaccinations per hundred (The darker the region, the higher the number of vaccinations)
- Scatter Plot Vaccinations per GDP
- KPI 1 Number of people within global population who are only partially vaccinated against COVID 19
- KPI 2 Number of people within global population who are fully vaccinated against COVID 19
- KPI 3 Percentage of people within global population who are only partially vaccinated against COVID 19
- KPI 1 3,838,352,700
- KPI 2 2,940,774,429
- KPI 3 51.26%
- We can therefore deduce that:
- During the period between 4 Sept 2020 and 25 Oct 2021, 48.74% of the global population had recieved at least one Covid 19 vaccination dose 897,578,271 more people were are only partially vaccinated against COVID 19 than those fully vaccinated during time period stated, which is a difference of 23%.
- There is a strong correlation between the GDP per capita of a region and the number of its population that are fully vaccinated.
Dashboard filtered to show data for the Continent of South America only

Key figures for this region during the time period stated now change from the global overview outlined above to the following:
- KPI 1 158,464,224
- KPI 2 115,489,354
- KPI 3 25.95%
- We can therefore deduce that:
- During the period between 4 Sept 2020 and 25 Oct 2021, 74.05% of the South American population had recieved at least one Covid 19 vaccination dose
- The number of people who were only partially vaccinated stood at 158,464,224 compared to the number of people within global population who are fully vaccinated, which stood at 115,489,354.
- Therefore 42,974,870 more people were are only partially vaccinated against COVID 19 than those fully vaccinated during time period stated, which is a difference of 27%.
Stacked Bar Chart - Partially Vaccinated (Green) vs Fully Vaccinated(Blue) Per Country in South America
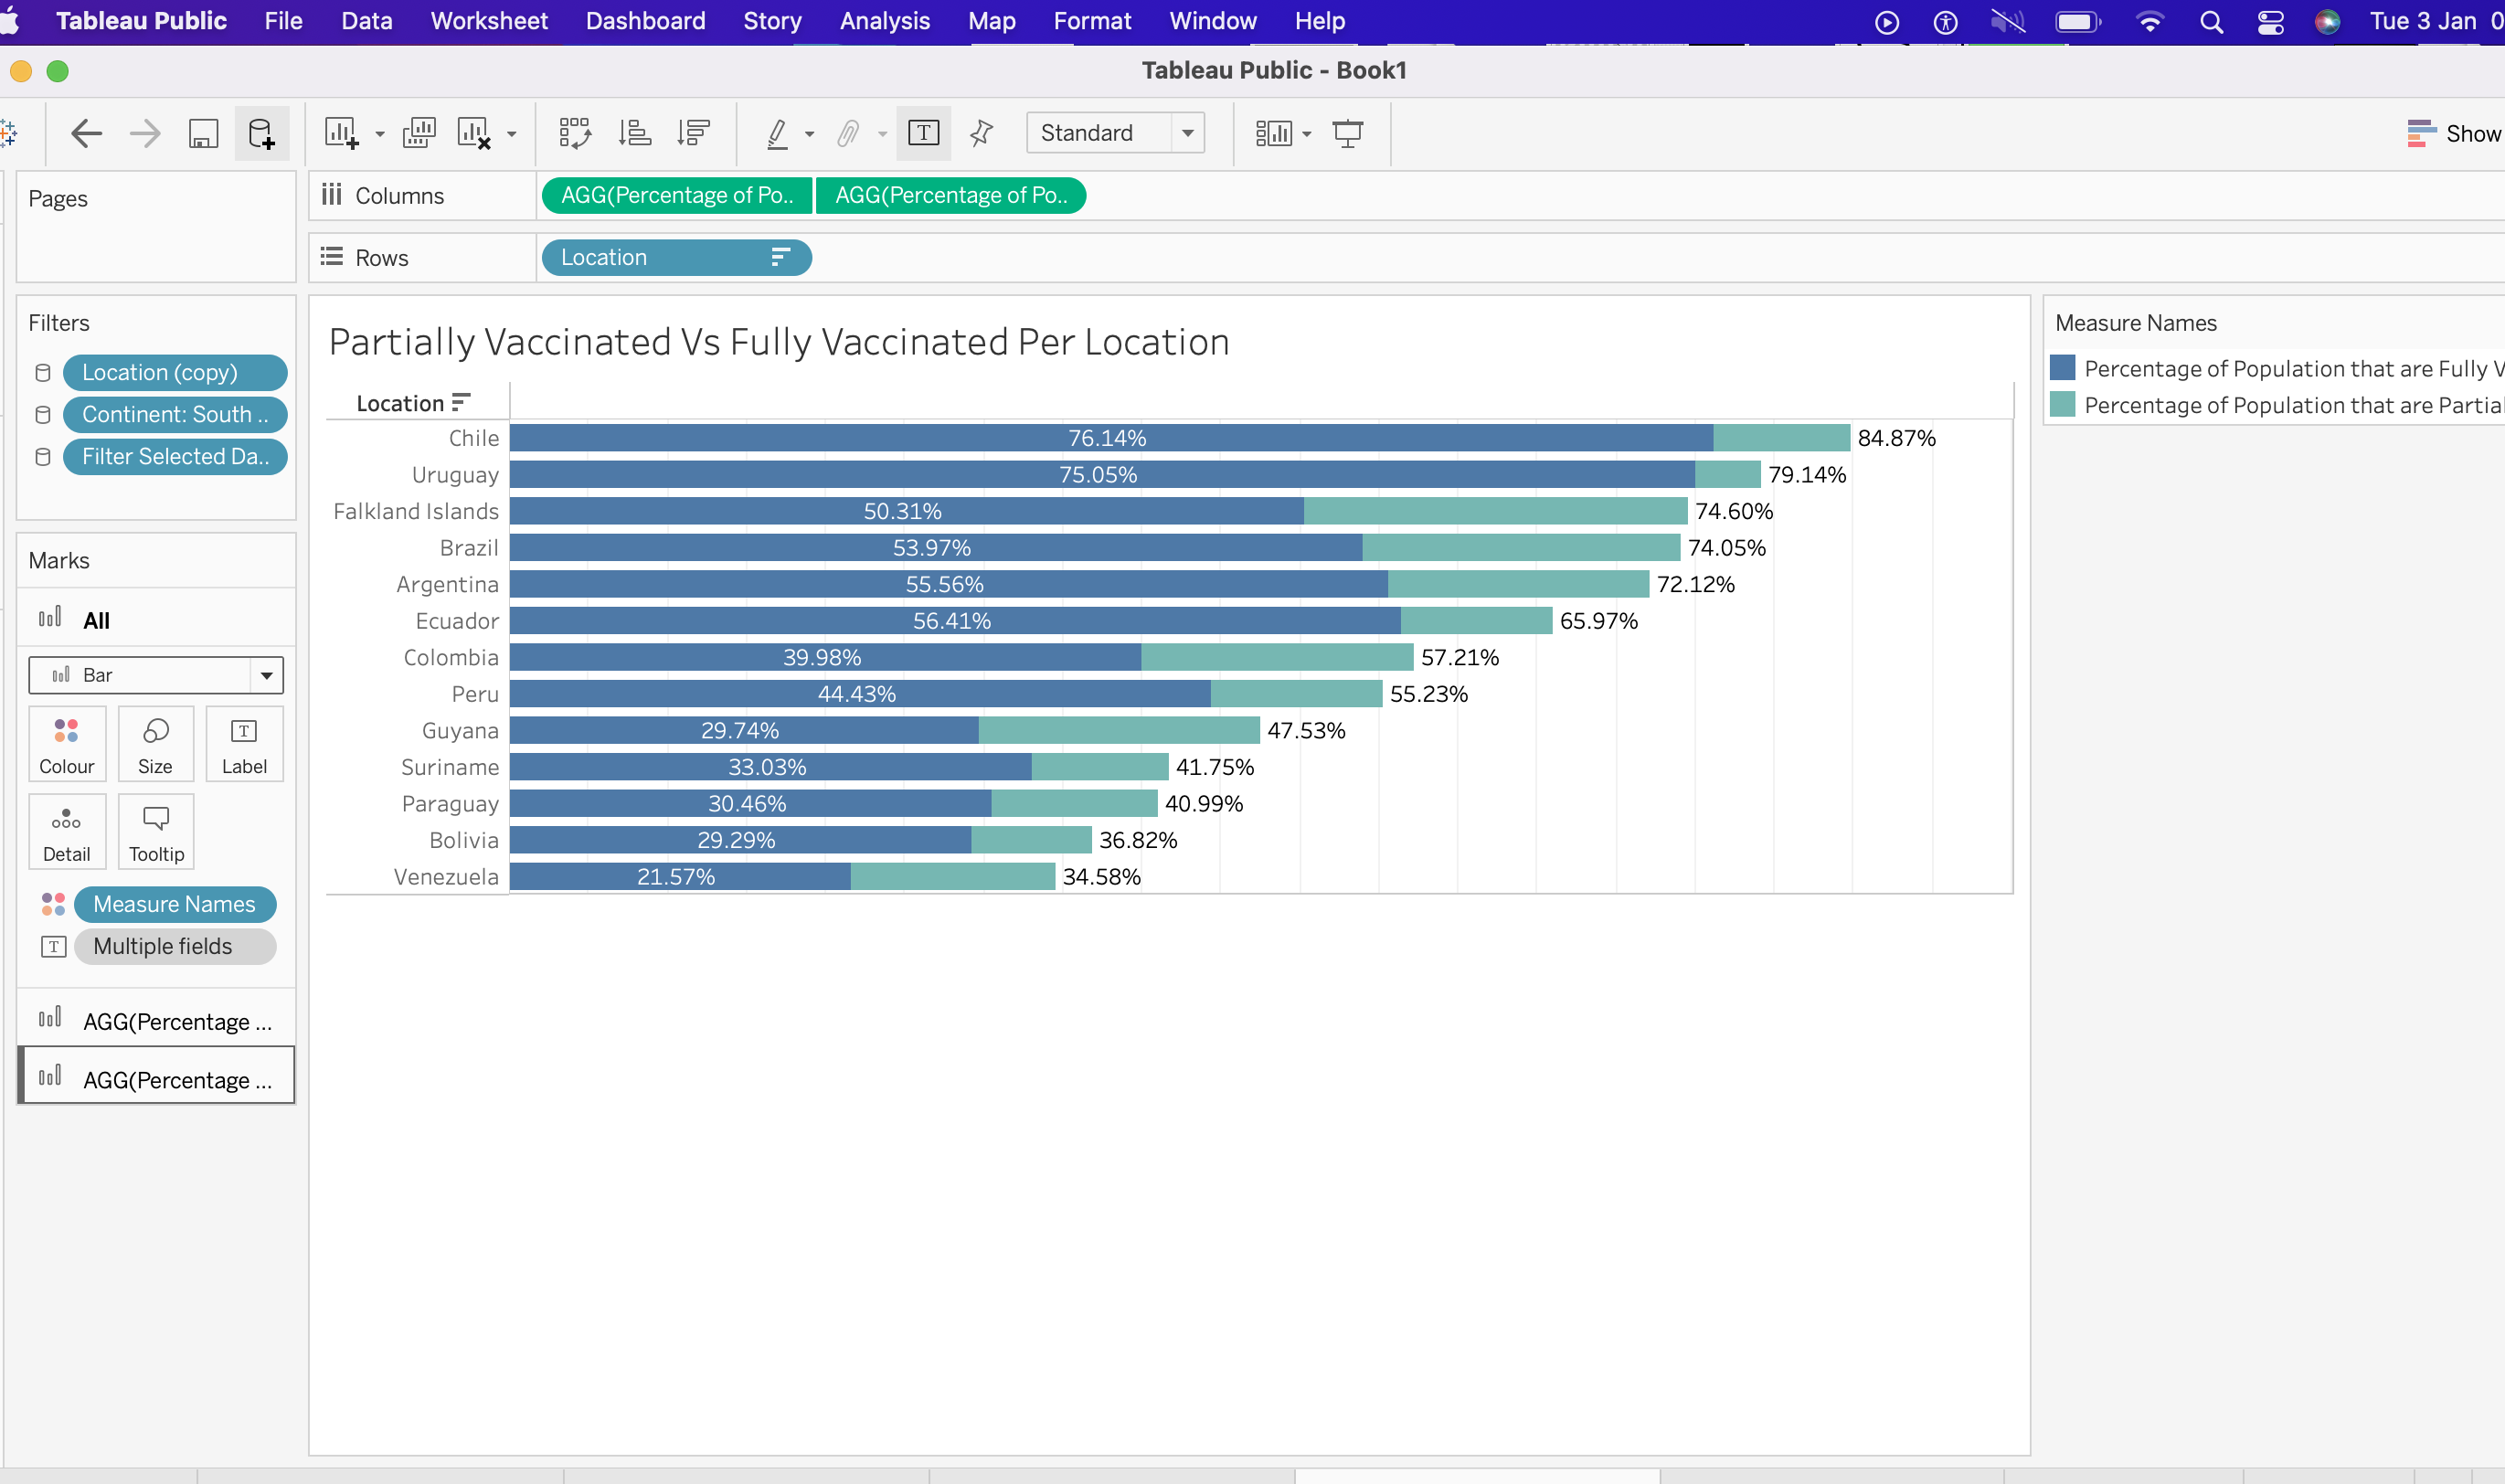
- The visualisation above clearly depicts Chile as the South American country with the highest number of vaccinations, with Uruguay coming in second.
- In Chile, 84.87% of the population had recieved at least one dose of the Covid 19 vaccination, 76.14% of which were fully vaccinated, only 8.73% were partially vaccinated (only received one dose). In Uruguay, 79.14% of the population had been vaccinated, 75.05% of those had been fully vaccinated, leaving only 4.09% of those that had been partially vaccinated.
- This is in stark contrast to Venezuela, where only 34.58% of its total population had been vaccinated, of which 21.57% had received all doses (fully vaccinated), while 13.01% of those who had been vaccinated, only received one dose (partial vaccination).
- We can also deduce that the disparity between full and partial vaccination in Venezuela is much higher than the top two vaccinated countries in that region, approximately triple that of Uruguay and just under double that of Chile.
- Colombia ranks in the middle of the dataset. It is clearly depicted as the country with 6 countries, above it that have a greater percentage of their population vaccinated, and the same number of countries, performing worse than it, with a lower percentage of population vaccinated.
Global Map - Geographical Vaccinations per Hundred (The darker the region, the higher the number of vaccinations)


The map above confirms above analysis, with Chile and Uruguay, depicted in the darkest hue, denoting the regions with the highest number of vaccinations per hundred and countries such as Venezuela and simular performing regions, showing up in lighter hues of green and Colombia depicted in a hue in the middle of the range of these two extremes.
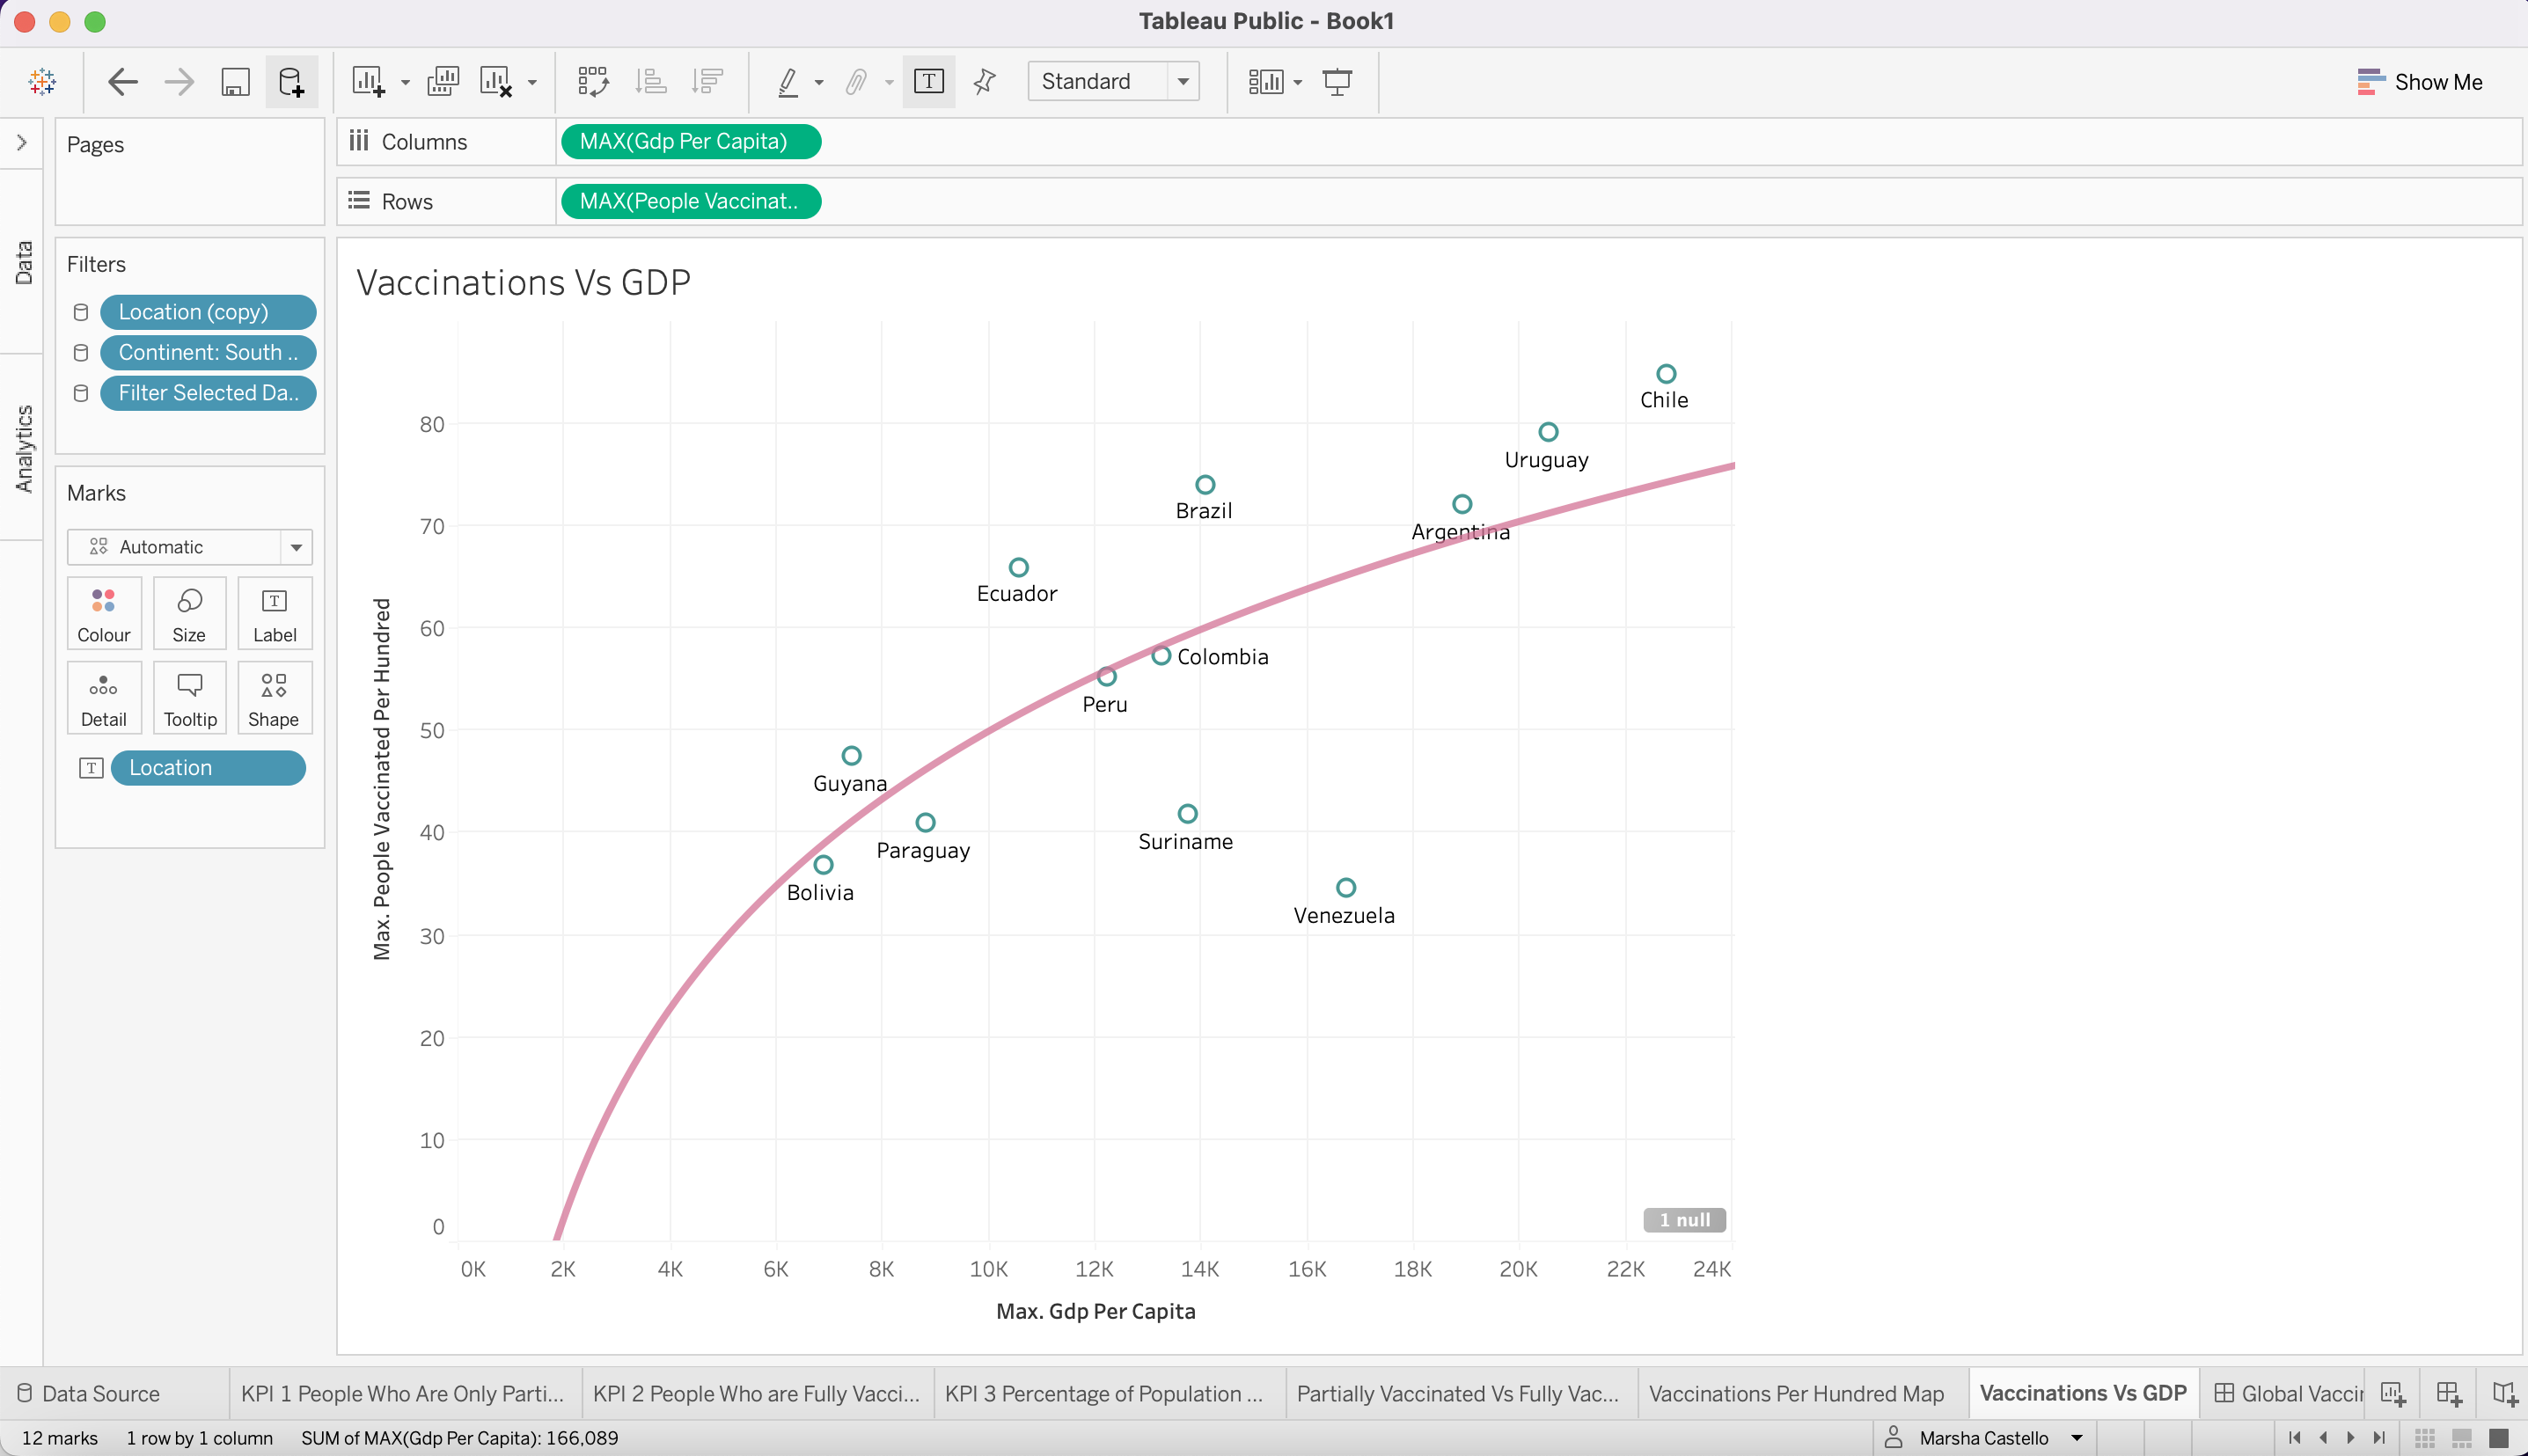
- In the scatter plot above, countries in the region are represented by green circles, the data points and a red line of best fit runs through the data points to display the relationship between countries with high rates of vaccination and the GDP per Capita of that country.
- GDP per capita provides a basic measure of the value of output per person, which is an indirect indicator of per capita income. Growth in GDP and GDP per capita are considered broad measures of economic growth. Sustained economic growth increases average incomes and is strongly linked to poverty reduction. In other words, when an economy generates more value per person per year, that typically translates into more money for those working in that economy. Higher incomes mean families can spend more on the things they value and the country as a whole would have better infrastructure such as a greater quantity and quality of hospitals, GPs and vaccination centres, educational institutions and access to information, transportation systems and access to travel.
- This visualisation shows that there is a strong positive correlation between the two variables, as GDP increases so does vaccination rates. Chile and Uruguay are at the top of the graph in the upper right portion of the graph (highest quartile) relatively close to the line, and countries such as Boliva close to the line and in the lowest quartile of the data(bottom left of graph).
- Countries such as Venezuela are outliers, furthest away from the line of best fit, followed by Suriname for countries with low vaccine take up.
- Venezuela is not beneath Bolivia in terms of GDP as the trend suggests, likewise for Suriname, which should be between Gayana and Paraguay.
- Brazil and Ecuador with relatively higher vaccine take up are also outliers and not positioned where would expect.
- This suggests that additional factors are coming into play for for these countries, with the outliers being more susceptible and that the wider sociopolitical climate should be considered for context.
Here I applied the country filter in addition to the continent filter already applied, to identify key figures to support analysis above, spot key trends and demonstrate tableau navigation skills. Visualisations and figures change in correspondence with the filters.

- Chile had the highest rate of vaccinations and had a GDP per Capita of 22,767
- Uruguay had the second highest rate of vaccinations and had a GDP per Capita of 20,551
- Colombia had the mid-range vaccination rate and had a GDP per Capita of 13,255
- Venezuela had the lowest vaccination rate and had a GDP per Capita of 16,745
- From the data above, we can see that during this time period, Venezuella's vaccinated population had been considerabley lower than Colombia, and yet with a GDP per Capita 23.27% higher, it would have been expected to be far above this Colombia in vaccine uptake.
- A total of 57.21% of Colombia's population had been partially vaccinated, performing 22.63% better than Venezuela.
- Where 39.98% of Colombia's population had been fully vaccinated, out ranking Venezuela, where only 31% of Venezuela's population had been fully vaccinated.
- With a GDP of 16,745, Venezuela's vaccinated population would be expected to be at the approximate mid point between Brazil and Argentina.
- Brazil which had a lower GDP than Venezuela of 14,103 far out performed Venezuella's vaccine uptake.
- A total of 74.05% of Brazil's population had recieved at least one dose of the vaccine, performing 39% better than Venezuela where in contrast, only 34.58% of the population had been at least partially vaccinated.
- Where 53.97% of Brazil's population had been fully vaccinated, only 31% of Venezuela's population had been fully vaccinated in striking comparison.
I decided to conduct further research to investigate why Venezuella had performed so badly, given that with its GDP it would have been expected to fair better. I identified that during this period, while many other countries (such as Chile, Uruguay, and Colombia) in the South America had all negotiated, well in advance, for the procurement of vaccines and were already implementing vaccination programmes, ahead of time, the Launch and Scale Speedometer shows that Venezuela had not. Venezuela had no known national COVID-19 vaccine plan, and consequently the supply of vaccines and health care was sporadic, inadequate to meet demand, and unplanned for. Source: The Lancet
My analysis proves there is a strong positive correlation between the share of a regions vaccinated population and it's GDP per capita. This is likely to be due to the wide known correlation between a countries comparative wealth and it's infrastructure. The greater the infrastucture, the greater a regions capacity to withstand shocks such as the COVID 19 pandemic. However, when there are other stronger variables at play, such as Venezuela's relative failure to take swift coordinated action, negotiate and forward plan in a simular fashion to other countries in the region, the the strong positive correlation and vaccinated population becomes negatively skewed. Thus the wider sociopolitical climate should always be considered for context
- Data Comprehension
- Data Mining, Modelling & Transformation
- Maths & Statistical Analysis
- Analytical & Visualization Skills
- Filtering, Sorting and Grouping
- Navigation of Tableau Software Suite