Goal – To analyse the ideal weighted portfolio of 5 stocks. In order to get the maximise return and minimise risk of the weighted portfolio, the data is combined into Jupyter Notebook and finalised by possibly using the efficient frontier analysis (https://pypi.org/project/pyportfolioopt/)
What can we do to get the highest return for the investment portfolio without the highest risk?
We use Pandas and Python on Jupyter Notebook to analyse the data and get the API accomplished through yfinance
Libraries:
- numpy
- yfinance as yf.download
- hvplot
- matplotlib
- pypfopt.plotting
- pypfopt.riskmodels and risk_matrix
- pypfopt.expected_returns and mean_historical_return
- pypfopt.efficient_frontier
- pypfopt opjective_functions
- seaborn
- script.optimize
Using of input function to let anyone can create their own portfolio analyzation by putting stocks' name in the input function
The needed installation: yfinance installation and pip install PyPortfolioOpt

Create the data frame by getting the data from yfinance as an API 5 Stocks plus the NASDQA 100 Index (10 years of data):
- NASDAQ 100
- META
- AMAZON
- MICROSOFT
- APPLE
- US 10 year Treasury yield
- Metrics to analyse each ETF: Using the data from yfinance for calculations: _Current US 10yr Risk Free Rate – 4.286% Calculate :Total Return – and plot the returns of portfolio


-
Calcuate rolling 180 day mean of cumulative stock price returns
-
Calculate rolling 180 standard deviation of cumulative stock prices
-
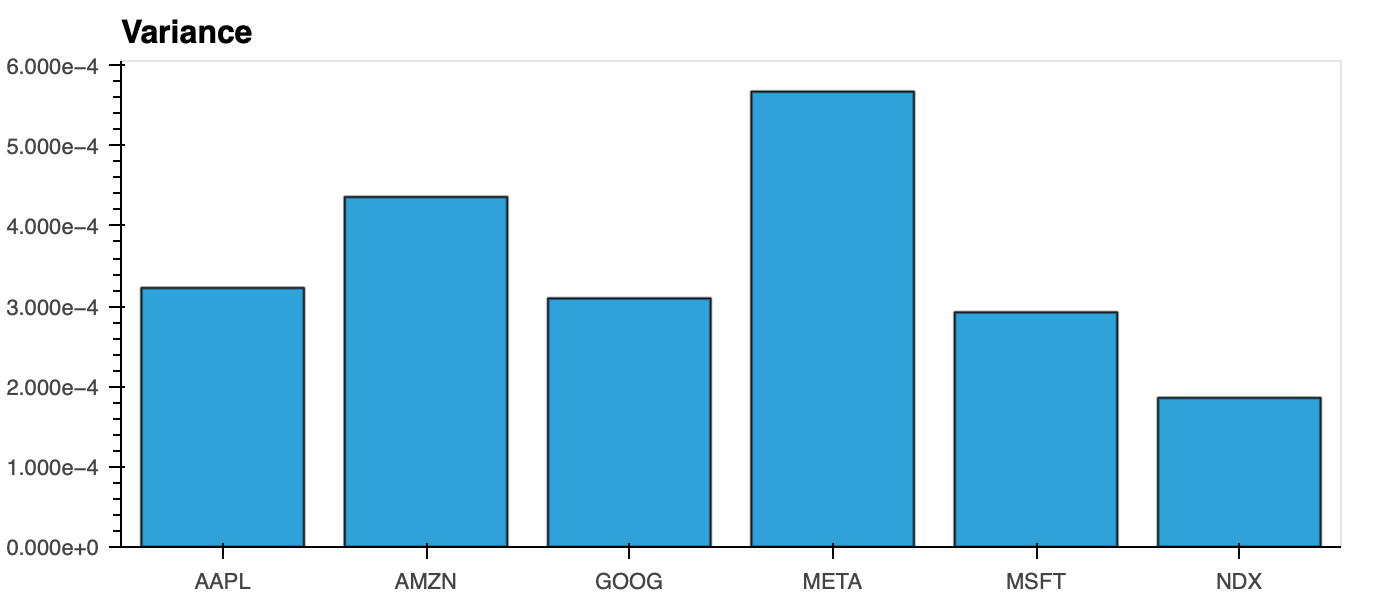
Calculate variance

-
Standard Deviation

-
Covariance matrix
-
Beta
-
Correlation Coefficient
-
Sharpe ratio and plot a bar chart

-
Risk matrix


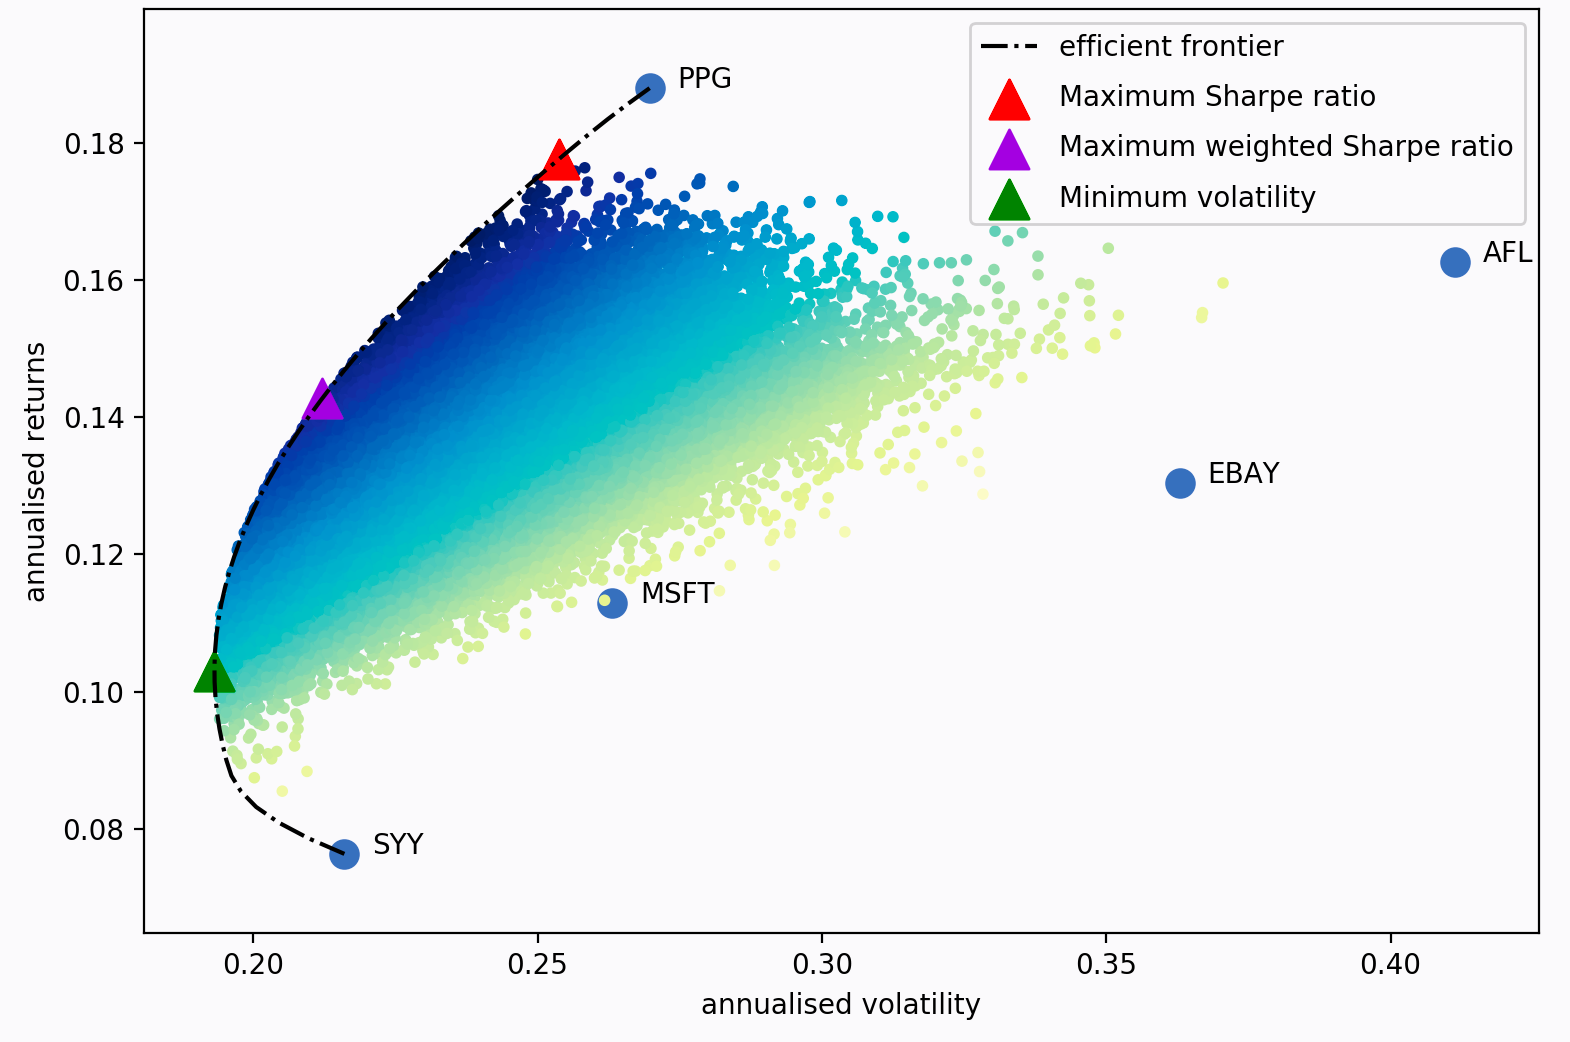
Volatility Create: the minimum volatility for the portfolio by EfficientFrontier(mu, s) function, we get the expected annual return, annual volatility and sharp ratio the max sharp ratio portfolio the max sharp ratio portfolio with the minimum allocation weighted stocks the return optimization portfolio by using pd.random.seed(777) to random allocate weights of the stocks so as to we will get the optimisation weighted portfolio with the minimum volatility and maximum return.


Josh Woods Matthew Tsiglopoulos Charinthip Songprasert
The MIT License is on GitHub to share a project on a repository.