Interactive Data Dashboard - BYOB (bring your own backend)
Based on this template by Piksl
- D3
- Node
- Express
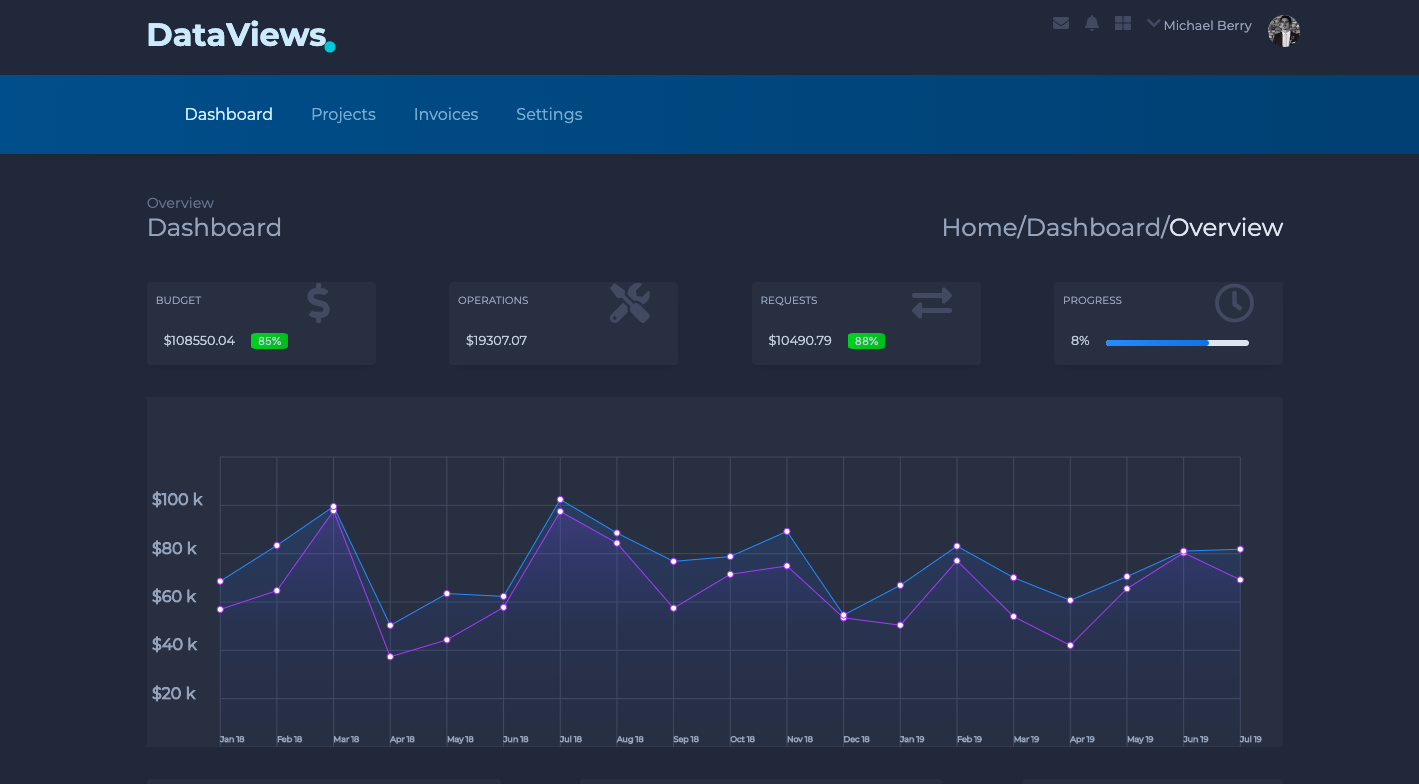
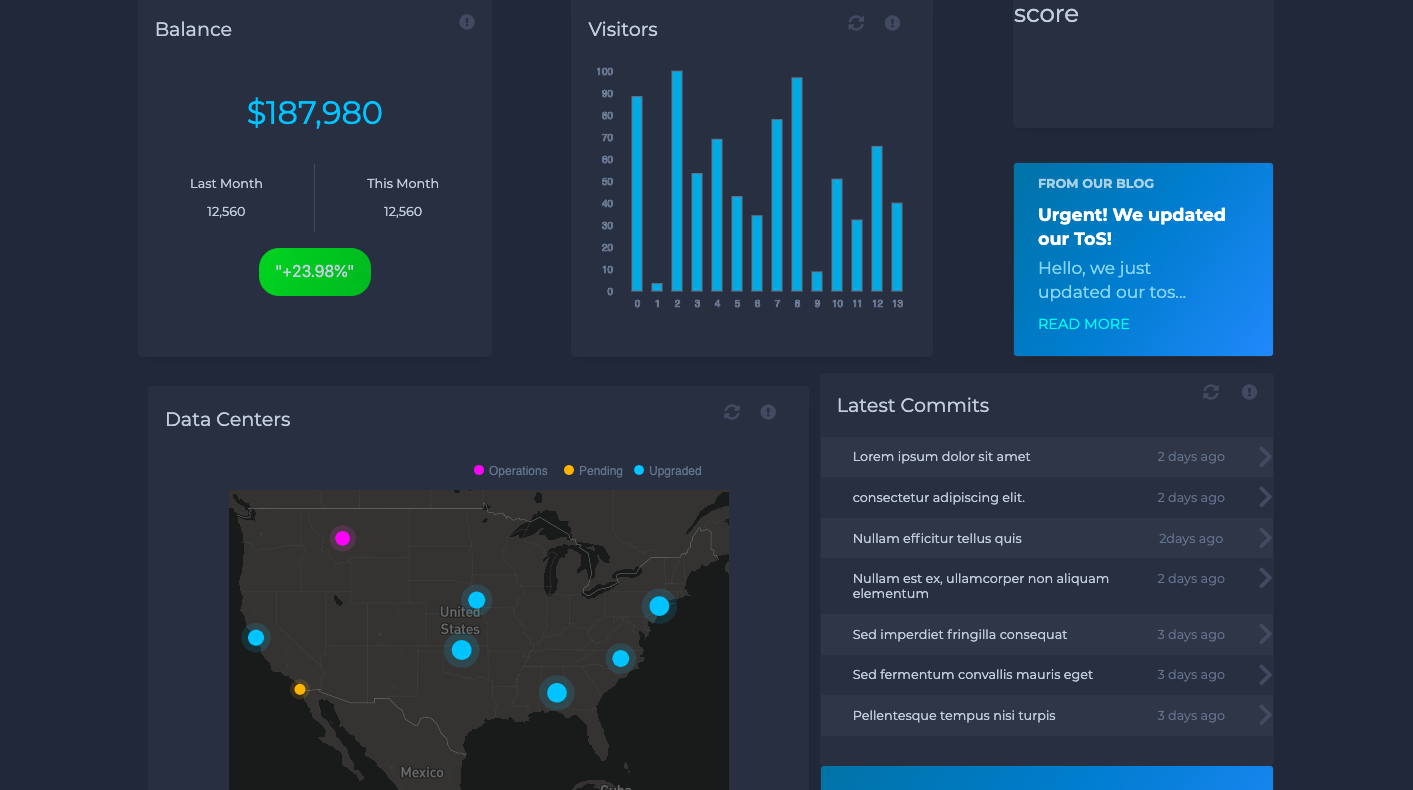
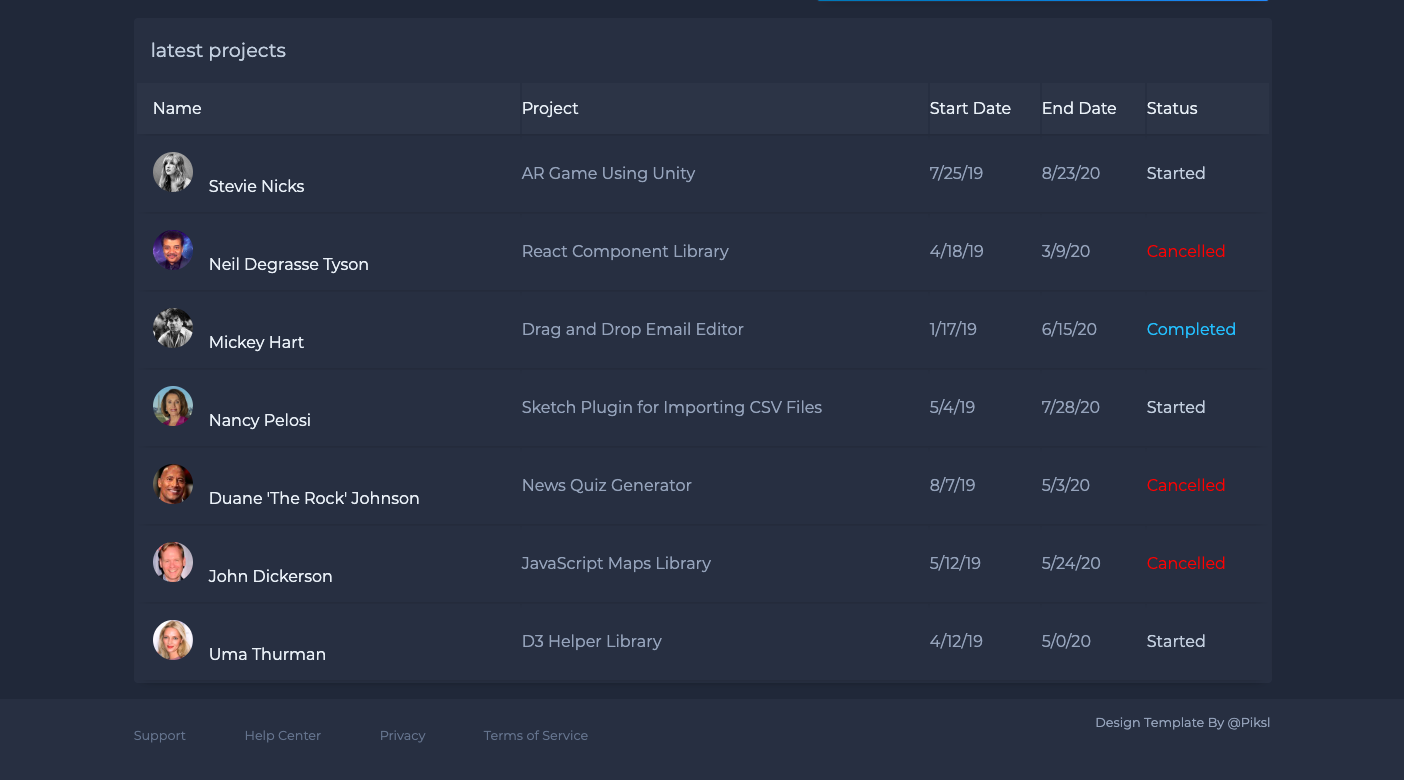
This is a series of charts showing arbitrary data which is generated on each page load. The idea to both gain more experience building different charts and graphics while creating a kind of template for users to bring their own data to this project to suit their needs.
Moving forward the goals will shift from this project being educational in nature to a functional and user friendly application.
Ideally users without a strong understanding of javascript will be able to provide inputs and controls to auto generate data.
- Mobile Responiveness
- I am intruiged by Story Book and am thinking of making each of these charts a series of react components.