Plotting
There are several settings that allow you to change the appearance of plots.
In the command line apps, take a look at parameters like --plot, --plot_mode etc. More general, package-wide settings can be set via evo_config set (see "Configuration" section). Have a look at evo_config show to see all available settings and their current values.
This is an example walkthrough for how you could theoretically change the plot settings to produce high-quality plots for print (thesis, paper...).

The default plot settings have a dark background. This looks good on the screen, but is not suitable for printing. We can change the background to a grid with white background by changing the style parameter of Seaborn with:
evo_config set plot_seaborn_style whitegrid
The default font doesn't really fit to the rest of our paper, which uses a serif font. The relative size of the text labels in the plot figure could also be increased for better readability. We can switch to a serif font with larger scale by calling:
evo_config set plot_fontfamily serif plot_fontscale 1.2
To match the smaller font, we also reduce the line width:
evo_config set plot_linewidth 1.0
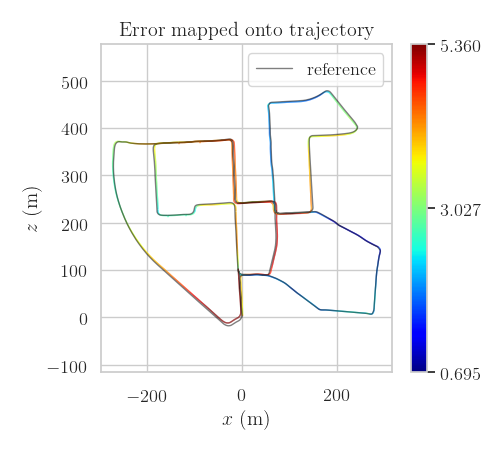
There are some other things you can change, for example the line style of the reference trajectory:
evo_config set plot_reference_linestyle -
You can adjust the default plot figure size, too. For example to a width of 5 and a height of 4.5:
evo_config set plot_figsize 5 4.5
Because we use LaTeX to write the paper, we want to render the fonts of the plots with LaTeX, too:
evo_config set plot_usetex
You may need to change the plot_texsystem parameter to the LaTeX system that's installed on your machine if this doesn't work on the first try, see evo_config show.
Advanced: plots can be also exported in pgf format (--save_plot plot.pgf).
evo_config reset
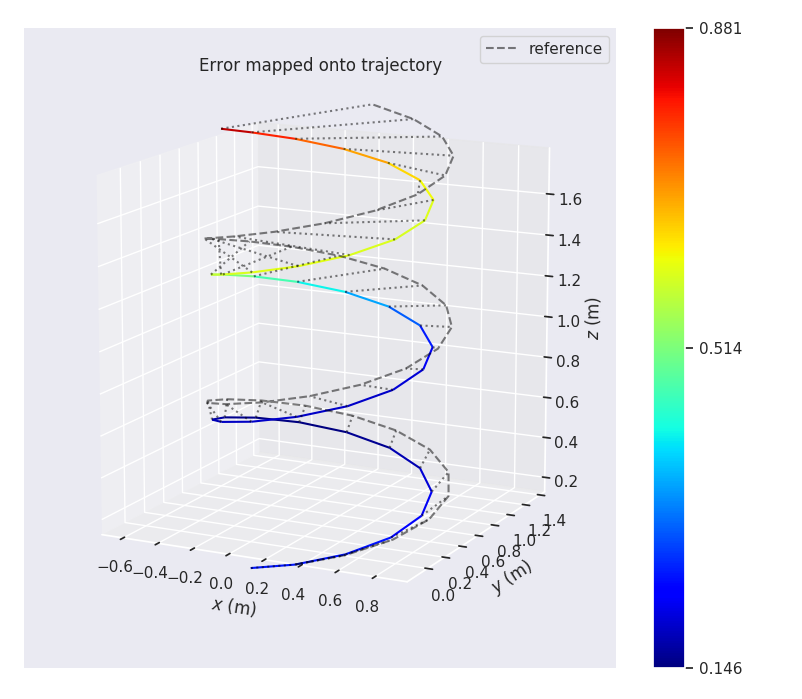
Coordinate axis markers can be activated by setting plot_axis_marker_scale to a non-zero value, for example:
evo_config set plot_axis_marker_scale 0.1
Reference trajectories have a separate parameter plot_reference_axis_marker_scale:
evo_config set plot_reference_axis_marker_scale 0.1
You probably need to play around with this scale value to adjust it to the size of your trajectories. Set it to 0 again if you don't need it anymore.

evo_config set plot_start_end_markers true
Start is marked with a circle, the end with a cross.

You can enable markers that connect the reference trajectory's poses with the corresponding poses in the other trajectories. This setting applies to evo_ape and evo_rpe, but also to evo_traj if you specify a --ref reference and the other trajectories are either synced or aligned.
Activate:
evo_config set plot_pose_correspondences true
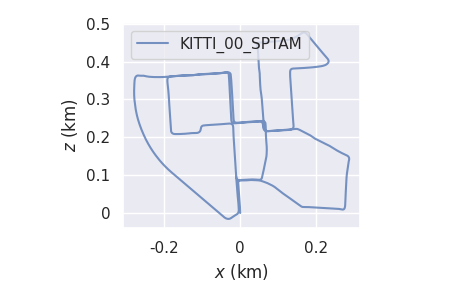
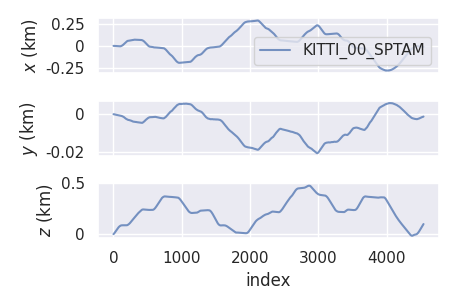
You can scale the axis ticks of trajectory plots to a different length unit. This can be useful if you have data at very small scale (cm, mm; e.g. from a phone) or very large (km; e.g. from a car). Note that this does not alter the data, it only changes the plot appearance.
Example:
evo_config set plot_trajectory_length_unit km
You can insert 2D maps that follow the ROS map_server format into plots. The format is described here: http://wiki.ros.org/map_server#Map_format
Given that you have such a pair of files (map.pgm and map.yaml), just add --ros_map_yaml map.yaml and the map will be shown in addition to the trajectories:

Note that this follows the ROS convention:
- the map is assumed to be in the x-y plane, so it will be only shown in the xy/yx plot modes
- the image will be transformed to the x-y plane's origin as specified in the .yaml file
In the above image the unknown cells of the map grid are not shown. To make this work, you might have to tweak the setting for the uint8 value that represents unknown cells in a ROS map image. ROS' standard map_saver uses 205, other tools might not (for example, Cartographer uses 128 for images of probability grids):
evo_config set ros_map_unknown_cell_value 128
But this can also be completely disabled. Then the bounding box of the map will be visible.
evo_config set ros_map_enable_masking false
You can define how the viewport will change when you plot a map by choosing one of the settings:
evo_config set ros_map_viewport {keep_unchanged, update, zoom_to_map}
This is especially useful when saving plots automatically and you don't want to edit the view manually all the time.


