Performance Issues
- Reporting a Performance Issue
- Visual Studio Code is consuming a lot of CPU
- Visual Studio Code is sluggish
- Visual Studio Code starts up slowly
To report a performance issue please use the 'Report Issue' command available in the 'Help' menu. In the Issue Reporter window that shows up, set the issue type to 'Performance Issue'.

The following sections describe how you can narrow down a performance issue.
High CPU consumption is often caused by an issue in an extension. VS Code is running multiple processes and extensions are executed by the Extension Host process.
Find out whether an extension is causing the high CPU load. You can open the Process Explorer using Help>Open Process Explorer to open a new window with a continuously updating list of VS Code processes.
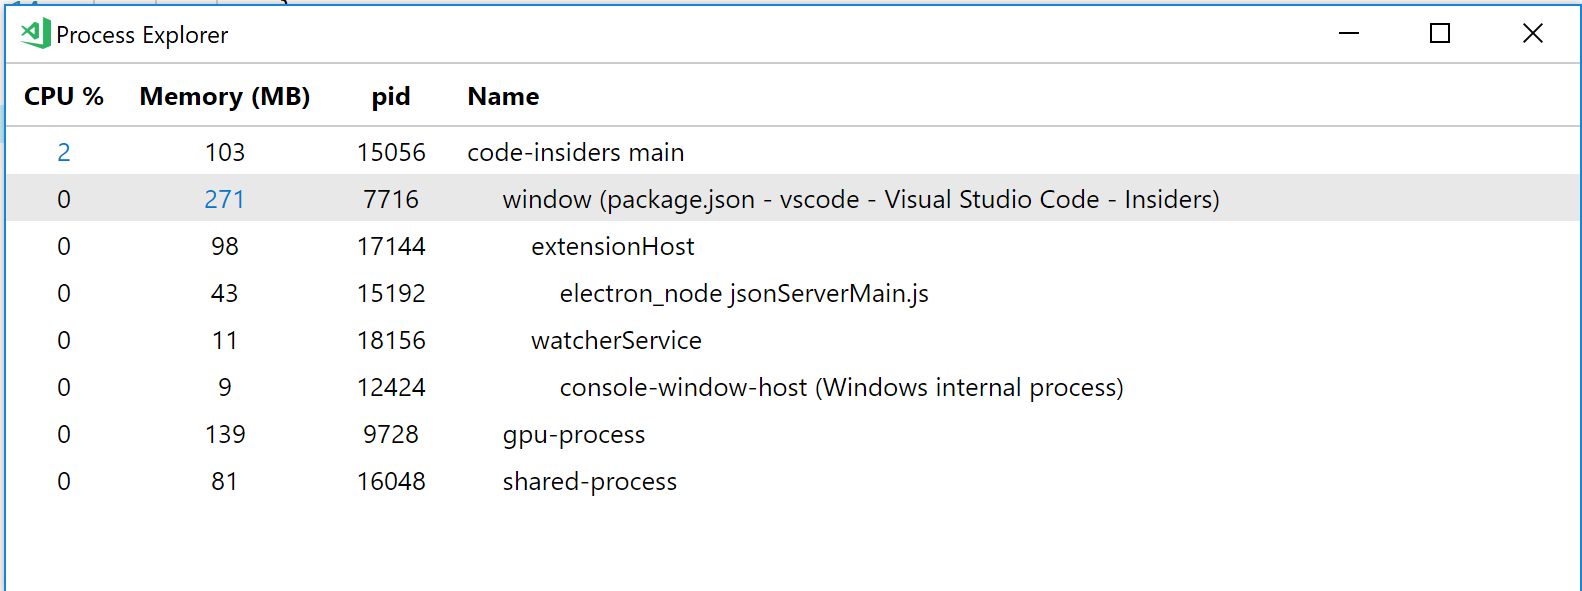
Try to reproduce the issue with this window open, or take a snapshot of the processes by running code --status from the command line. For information on how to run code from the command line on OS X please see the setup documentation. When the process listing in the Process Explorer or the output of code --status shows that the extensionHost is consuming a high percentage of CPU (see below) then this is likely caused by an extension.

The first step is to try to reproduce the problem with all extensions disabled. You can disable the extensions either from the command line using the --disable-extensions command line argument, e.g., code --disable-extensions or from the ... menu in the Extensions Viewlet:

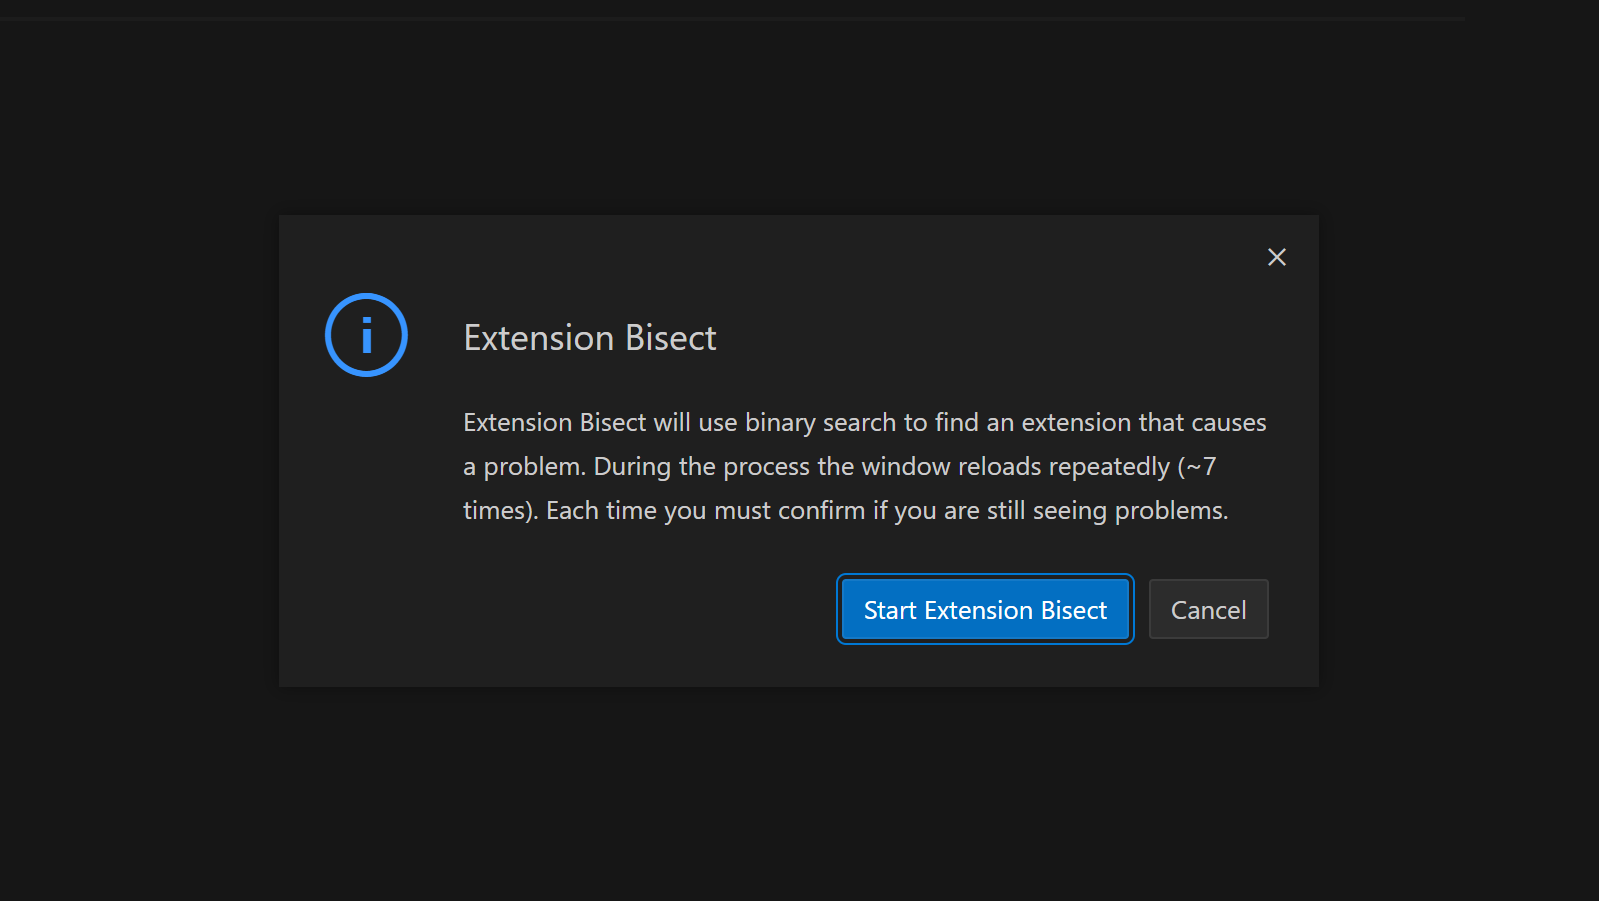
If you cannot reproduce the issue when all extensions are disabled, then can you narrow down the extension by selectively disabling extensions? You can identify the extension which causes a performance issue by executing "F1 > Help: Start Extension Bisect". This will run binary search on your installed extensions by disabling some, reloading the window, and asking you whether the issue that you saw still occurs, until a single extension has been identified.
Alternatively, you can manually disable extensions in the Extensions Viewlet and restart/reload.

Once you found the extension, please file an issue against the extension. To file an issue against an extension open the Running Extensions editor by executing "F1 > Developer: Show Running Extensions" and use the Report Issue button or find the extension in the marketplace, and use the Issues link in the Resources section.
You can create a CPU profile and share it in the issue with the extension author or us. To create a CPU profile:
- Execute "F1 > Developer: Show Running Extensions." This command opens an editor with all the running extensions.
- To start recording a profile click the run control in the editor's title bar:

- Perform some steps in VS Code that expose the slowdown
- Stop the recording using the same control.
- Save the extension host profile:

- Attach the profile to a Github issue.
To analyze the performance yourself, you have two options:
- Remove the trailing
.txtsuffix from the profile name. - Open the file in VS Code with our built-in profile viewer. Install the Flame Chart extension when prompted, if desired.

- Change the file extension to
.json - Toggle the developer tools
Help > Toggle Developer Tools - Open the Performance tab
- Load the profile using the
Loadbutton.
If you can reproduce the problem with extensions disabled, then use code --status from the command line.
Notice: this command requires that VS Code is already running
This command collects status about your running VS Code and the workspace you have opened. You can attach this information when reporting a performance issue.

The output includes information about the environment, all running VS Code processes, and the counts of some typical files in the workspace.

Try to reproduce the problem on different folders; a folder with less files, a folder that is not under source control, or open a single file.
Try to reproduce the issue in the VS Code Insider version. This will run our latest code and use a different setup (settings, extensions). You can install the insider version here https://code.visualstudio.com/insiders.
Run VS Code when your settings are reset/empty. Open your settings, copy your customizations and then empty the JSON contents so that only {} is left.
Run VS Code in verbose mode and check whether there is any suspicious output in the console or the developer tools. You start VS Code in verbose mode with code --verbose. Also, open the DevTools ("Help>Toggle Developer Tools") and open the console there.
Very detailed information is captured in CPU profiles and that helps us best to narrow down on a slow-down. So, please create a CPU profile of the VS Code core (renderer process) and attach it to the issue. To create a profile:
- Execute "F1 > Toggle Developer Tools." In the overflow menu of the developer tools
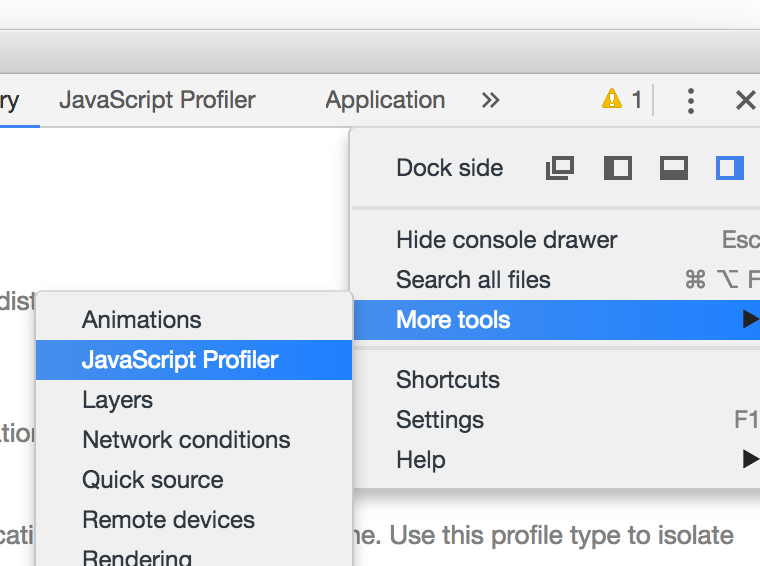
- Select 'More Tools > JavaScript Profiler'. In there select start.
- Let it profile for 30 to 60 seconds, stop it.
- When the performance issue happens on startup, start the profiler and then reload the window using "F1 > Reload Window."
- Save the profile to a file and attach the file to your issue.

Try to reproduce the problem on different folders; a folder with less files, or open a single file or open an empty window,
Try to reproduce the issue in the VS Code Insider version. This will run our latest code and use a different setup (settings, extensions). You can install the insider version here https://code.visualstudio.com/insiders.
Run VS Code when your settings are reset/empty. Open your settings, copy your customizations and then empty the JSON contents so that only {} is left.
Run VS Code in verbose mode and check whether there is any suspicious output in the console or the developer tools. You start VS Code in verbose mode with code --verbose. Also, open the DevTools ("Help>Toggle Developer Tools") and open the console there.
Very detailed information is captured in CPU profiles and that helps us best to narrow down on a slow-down. So, please create a CPU profile of the VS Code core (shared process) and attach it to the issue. To create a profile:
- Execute "F1 > Toggle Shared Process." In the overflow menu of the developer tools
- Select 'More Tools > JavaScript Profiler'. In there select start.
- Let it profile for 30 to 60 seconds, stop it.
- Save the profile to a file and attach the file to your issue.
If VS Code is slugging when scrolling, moving mouse or typing, please create a performance profile. Do the following
- Toggle the developer tools Help > Toggle Developer Tools
- Select 'Performance'. In there click the record button.
- Scroll, type or any operation leads to the slowness of the UI
- Let it profile for 30 to 60 seconds, stop it.
- Save the profile to a file and attach the file to your issue.
If VS Code is slow to start then please create a startup CPU profile. Do the following
- Make sure to only have one window open
- Quit VS Code (CMD+Q for Mac, closing the last window on Linux/Windows)
- Start VS Code from the command line like so
code --prof-startup - VS Code will start and create two profile-files in your home-directory. Please attach these files to your issue or create a new issue with these two files
When VS Code feels slow to start, you can check the startup timers. Hit F1 and select "Startup Performance." This will open an editor with all starting performance details
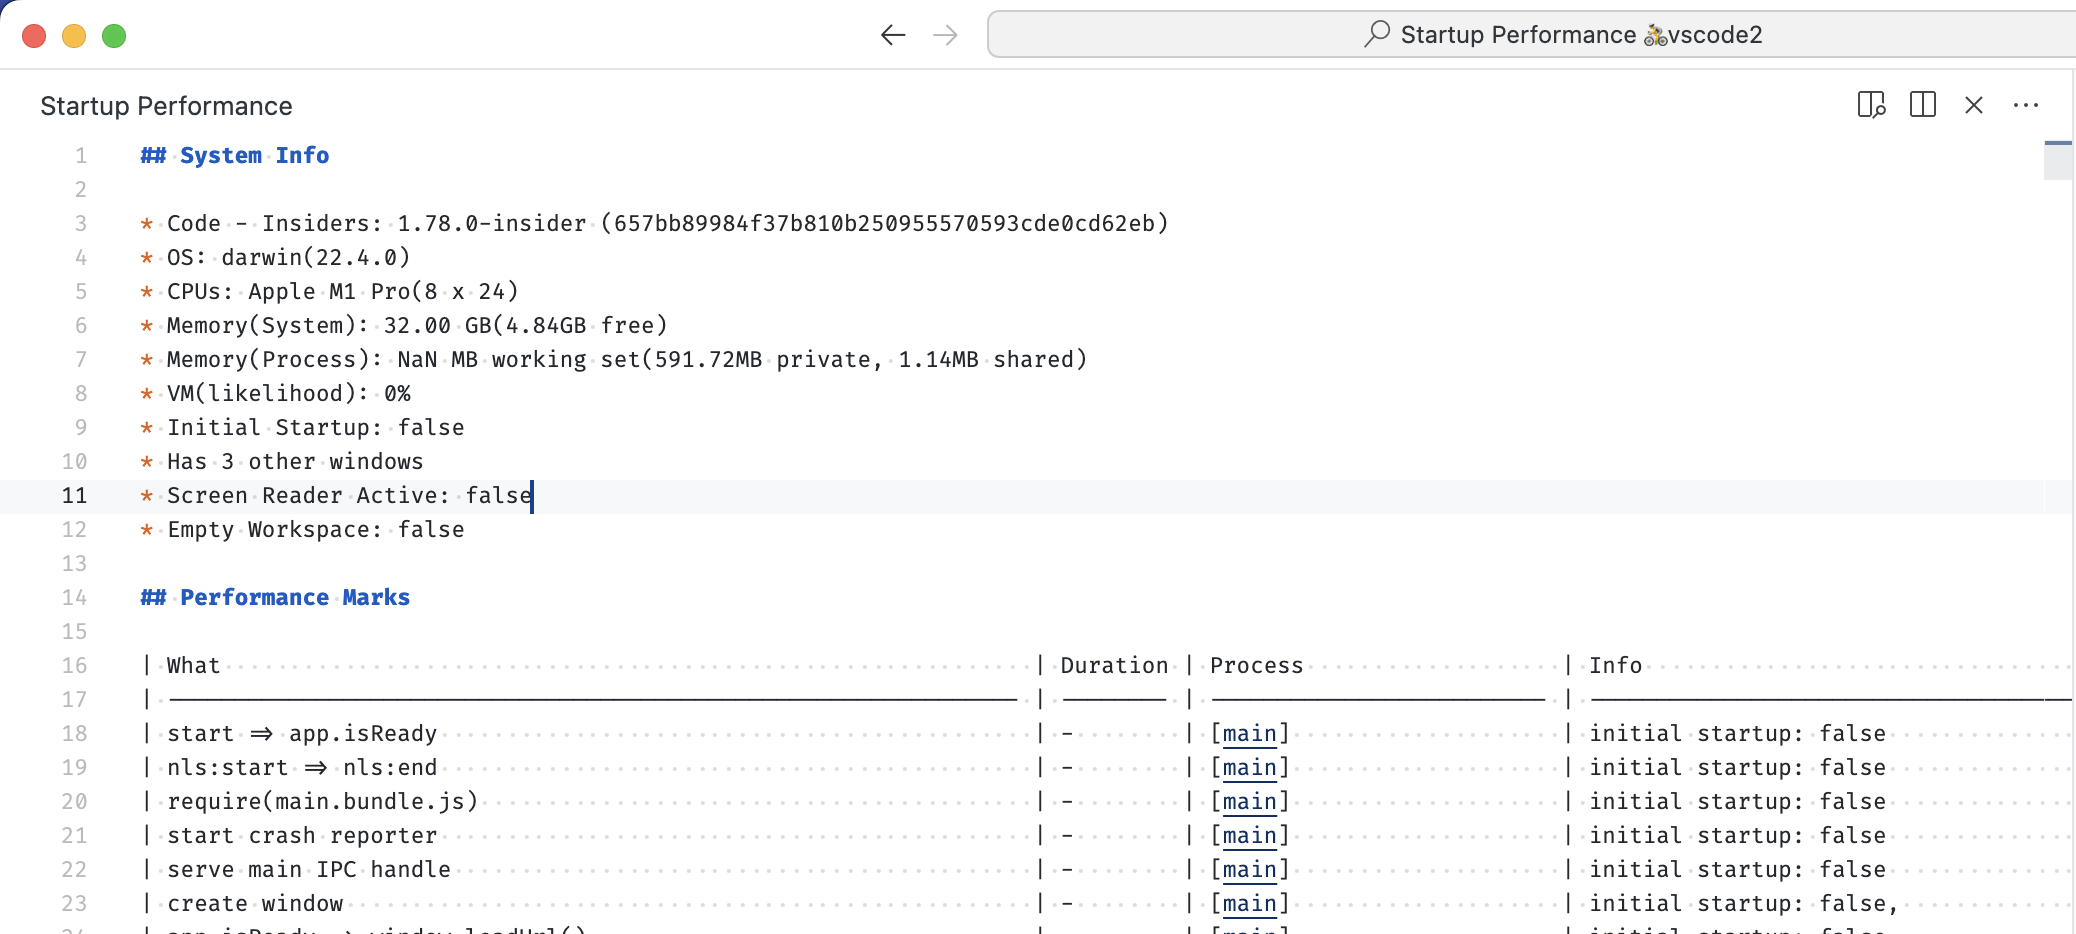
Please share these numbers with us as they often allows us to understand what is slow.