Options
Wiki Pages: Home | FAQ | Setup | Options | Events | Theme | Change
- This is the class added to the grip/handle to add extra styling.
- It can be any css class name.
- Look for the preset styles in the "pathslider.css" file named "black", "silver", "chrome1" and "chrome2".
- Default setting is an empty string (
'').
- When true, the grip/handle will rotate using css3 transformations to match the pathslider curve.
- When false, the grip does not rotate
- The grip always gets it's
data-degreesattribute updated with the current angle - I plan on changing this todata-anglein the next update. - Default setting is
true.
- When true, this option will add a canvas under the slider and draw the curve.
- The curve is drawn using the style settings from the
curveoption below. - If the browser does not support the canvas tag, this option is ignored.
- The curve is drawn using the style settings from the
- When false, no canvas is added to the slider.
- Default setting is
true.
- This option contains an object with the canvas curve style settings
- It has settings for the curve
width, set as pixels. - The curve
colorstyle can be set. At present, the builder only allows a solid color. In future versions of the builder, I hope to include a method to include a gradient or pattern. - The
capsetting determines how the end of the curve is drawn. Canvas settings are "round", "butt" and "square". Please see this page to see the differences in these settings. - The default setting is
{ width: 4, color: "#333", cap: "round" } - In version 1.0.0, if the
colorsetting is an array of two colors:- The first color will apply to the portion of the curve to the left of the grip, and the second color will apply to the curve right of the grip.
- This method adds a linear gradient which works well on linear sliders. Sliders that loop back on themselves (like presets 4 & 5 of the builder demo) will not accurately add the gradient colors using this method.
- This option sets the starting percentage value of the grip on the curve.
- The curve, at this time, starts from zero percent (green control point) and ends at 100 percent (red control point).
- The grip is set as a percentage and is limited to any number between 0 and 100 (fractional percentages allows, i.e. 43.7%).
- The percentage value is updated as the grip moves both in the option and in the
slider.percentvariable (see events page for more details). - In future versions, this
valuewill be an actual value between a set minimum and maximum numerical value. - The default value is
50(percent).
-
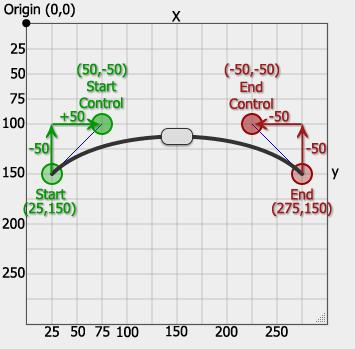
This option sets the bezier control points.
-
Currently, the bezier curve requires four points: start, start control, end control and ending points.
-
If you've ever used Adobe Illustator or Corel Draw, you'll recognize this curve.
-
These points are set up as follows: Given these points
// sx,sy     = start x & y
// csxo,csyo = control start x & y offset from start point
// cexo,ceyo = control end x & y offset from end point
// ex,ey     = end x & y
//       [ sx,sy,  csxo,csyo, cexo,ceyo,  ex,ey  ]
points : [ 25,150,   50,-50,   -50,-50,  275,150 ]
-
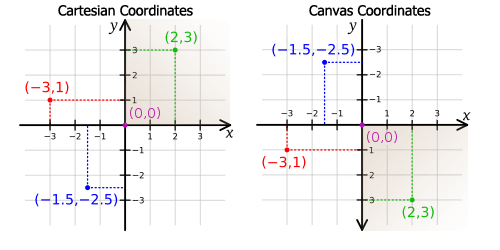
Additionally, it would help to be aware that the canvas coordinate systems has a flipped y-axis when compared to the cartesian coordinate system
- This option contains the total number of points along the curve that will be saved while the curve is being built.
- Increasing the number of points will smooth out the grip movement along the curve, but could slow down initialization and processing when the window resizes.
- When increasing this number, increase it in increments of 100 (100, 200, 300, 400, 500). But don't go higher than 500, or you'll notice the lag.
- I plan on making the script automatically determine this number; or use a completely different method eventually.
- Default value is
100.
- This value is the number of points to test around the current point (in the positive and negative direction), so 3 would test 6 data points on either side of the curve.
- Increasing this number will actually allow you to scroll faster, but it makes the grip jump around more.
- The builder has this value limited to a range of 1 to 5. But if the number is any higher, there is no noticable difference.
- Default value is
3.
- This value is the distance between the mouse cursor and the curve to search for a matching x/y value.
- Optimally, this value is set to be around the same width of the grip.
- Adjust this value to smooth out the grip movement (smaller is smoother, larger moves faster)
- The builder has this limited to a range from 20 to 50 pixels.
- Default is
30.
-
This callback function, added in v1.0.0, is called before create and slide events to allow modifying the canvas.
-
This function is never executed if the the browser does not support the use of canvas or the
useCanvasoption isfalse. -
Use this callback to add a gradient stroke, or apply any desired canvas changes.
-
The canvas (
ctx)lineCap,lineJoin,lineWidthandstrokeStyleare set from the plugin options before this callback. Modify them as desired, or if applying other changes to the canvase, make sure to draw the curve first - useslider.finishCurve(ctx, points) -
The canvas
beginPath,moveTo,bezierCurveToandstrokefunctions are executed after this callback, unless you explicitlyreturn falsefrom thedrawCanvasfunction. It was done this way just in case you have already performed those drawing functions. -
This example shows how to add a linear gradient (same method used when the
curve.colorsetting is an array). It works well on linear sliders. Sliders that loop (like presets 4 & 5 of the builder demo) will not accurately add the gradient colors using this method.drawCanvas : function(slider, ctx, points) { // slider.ctx === ctx // slider.pointsxy === points // *** if drawing something else on the canvas, make sure finish drawing // the curve first! // slider.finishCurve(ctx, points); // *** var start = slider.percent / 100, grad = ctx.createLinearGradient(points[0], points[1], points[6], points[7]); grad.addColorStop(0, '#f00'); grad.addColorStop(start, '#f00'); if (start + 0.01 <= 1) { start += 0.01; } grad.addColorStop(start, '#00f'); grad.addColorStop(1, '#00f'); // assign gradients to fill and stroke styles ctx.strokeStyle = grad; // return a false value to prevent the curve from being drawn // in case you already did it! // return false; },
-
The following canvas functions are executed after the
drawCanvascallback, ifreturn falseis not used:ctx.beginPath(); ctx.moveTo(points[0], points[1]); ctx.bezierCurveTo(points[2], points[3], points[4], points[5], points[6], points[7]); ctx.stroke();These canvas functions are included inside of
slider.finishCurve(ctx, points).
- The
create,update,start,slide,changeandstopcallbacks are called when the event is triggered. For more details, see the Events page.