Data Overview
ED4scan will present the collected data in sections for better readability. Here you will get an overview of the readouts.
When data is collected (normally with a lot of queries) you will get a status message like this "Reading data........". Each dot stands for a successful measurement.
-
Odometer and Ambient Temperature
ODO : 10342 km, Amb.T: 6.1 degC
The actual Milage and outside temperature read from multifunction display. Odometer in km, temperature in °C. -
General Battery Data
SOC : 62.0, 61.6 % = 10.28 kWh = 93 kmBattery State of Charge. The first SOC represents the value of the User SOC from the BMS and the second one reflects the EVC SOC value. The value in the dashboard will be slightly lower or higher (about +- 2%) depending on real driving conditions. The normally usable capacity (0 to 100% SOC) will be about 16.25 kWh of energy. In addition the corresponding range (and ECO mode) will be displayed, too.rSOC : 95.2, 97.2, 97.3 %These are the realSOC values, reflecting the real energy of the battery system. They are internal values of the BMS with a min-, average- and max-value.HV : 399.0 V, -0.66 A, -0.26 kW
High Voltage readings of the battery. Total voltage, the current and the calculated power.LV : 13.5 V, 3.1 A, 40 W, 21 %On-board voltage of the 12V-battery and the DC/DC (while car is activated). Including current, power and load ratio of the DC/DC output.EV : OFF, slow CHG, 87.0, 11.5, 0.0 kWStatus of the EV [ON/OFF], status of HV-System [ON/OFF/slow CHG/CHG] and power values of the battery: max. capable, max. regeneration, max. charging. These values will vary by the driving condition, SOC and temperature! -
General Battery Status
SOH : 100.0%, OKThe State of Health of the battery monitored by the BMS. When the state is settled it will readOK. Otherwise the BMS is still evaluating the current conditions and an undefined state is shown (UNDEF), followed by the SOH flag in HEX (like:SOH : 100.0%, UNDEF, E).Y/M/D: 2017/4/13The production date of the battery.BCS : W+AC, BHS: W+PTCList of the installed Battery Cooling / Heating System.BCSshows the cooling abilities:-
W= water,W+AC= battery cooling ability with chiller by AC system (option V03)
and
BHSan installed heater:-
W+PTCadditional heater core (PTC) in water cooling loop.
-
-
Cellvoltages from the BMS
CV mean : 4145 mV, dV = 26 mV
CV min : 4132 mV, LIM: 2504 mV
CV max : 4158 mV, LIM: 4194 mV
Cell voltages as mean, minimum and maximum value and the limiting range (LIM).dVis the delta between min and max.Ri in,out: 132, 132 mOhmActual internal resistance of the complete Battery.Balancing: 800, XOR: 0I suspect this to be the Balancing Status. HEX-Values >=800 indicate that balancing is active. 800 will indicates minimal activity. XOR value for testing the balancing-mode of all cells. -
High Voltage Contactor
HV contr.: ON
Cycles : 199012 of 200000
The car has a special high voltage, high current contactor to disconnect from the battery system when it is inactive. Here you get the cycles of the contactor left (and the possible count - by design).In addition the isolation of the DC circuit will be measured:
DC iso. : >10000 kOhm, MF:11000. This is not the real, triggered measurement. It will represent the status (in range or not) of the last successful value.MF:will display some binary flags for testing purpose. -
Battery Temperatures
mean: 10, min : 10, max : 11M 1: 10, 11, 11, 10, 10, 10, 10, 10, 10
M 2: 11, 11, 11, 11, 11, 11, 10, 10, 10
M 3: 10, 11, 10, 10, 10, 10, 10, 10, 10Temperatures of the battery system. Each Module has nine thermal sensors.
-
Capacity Measurement of the BMS
Measured : 57.389, 57.411 (SOH)The first value will show the measured capacity, depending on the used method (CONT or dSOC). The second value is the estimated capacity reflected by the SOH algorithm. This value should be identical to thebms sohreadout, done by another query.These values do not indicate the real charge! They seem to be based upon reference values / temperature data and reflect the total, electrochemical energy stored in the battery - not the usable window for driving!
Estimate : 0.722 of 0.722, 0 day(s)
The BMS does monitor the capacity of all individual cells during charge. It will show the number of days since the last successful measurement:
0 day(s)indicate refreshed values. This counter is reset by the BMS itself and can not manually be altered. The quality of the measurement will be estimated. Values >0.8 indicate a very good, reliable result. The quality will be improved by a large ∆SOC. During driving the actual estimate (1st value) will indicate that the BMS is keeping track of the usable capacity. If this will differer significant from the measured value the pack/cells are drifting apart - so keep an eye on the balancing...Two algorithms are used. One will rely on a large difference in SOC (dSOC) and the other uses the calculated internal impedance of the cells and the OCV lookup combined with measured currents. Please find my thoughts about the capacity of the pack here.
Capacity : 55.861 (INIT), 55.861 (EST)
For the calculation of the battery health two capacity values are stored / maintained. The initial (INIT) capacity and the estimated, usable capacity (EST), that will probably change during aging of the battery. -
Individual Cell Statistics
Here you will find the real measurements of the BMS (done during a charge). A good battery will have only one cell with a slightly lower voltage than the maximum value (about
dV = 25 mV). Please also monitor the standard deviations. It will give you an idea about the scattering of the voltages around the mean value. A standard deviation ofs < 5 mVor lower is good.CV mean : 4155 mV, dV= 26 mV, s= 2.61 mV
CV min : 4132 mV, # 69
CV max : 4158 mV, # 91Those statistics will also be calculated for the cell capacities:
CAP mean: 20694 As/10, 57.5 Ah
CAP min : 20600 As/10, 57.2 Ah, # 84
CAP max : 20810 As/10, 57.8 Ah, # 59The cell with the minimal capacity / high internal resistance will limit the usable energy of the complete battery. The cells are connected in series and the weakest cell will run down first.
Usebms rescommand for an overview of the individual relative cell resistance values. -
Voltage Distribution as Box Plot
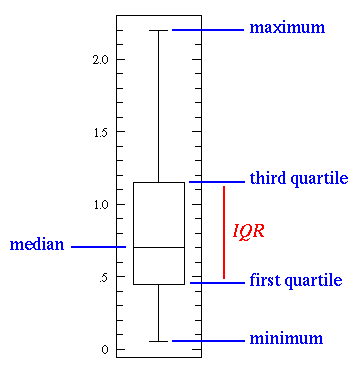
The voltage levels of the battery cells in the pack are not evenly distributed. The standard deviation will not represent a good indicator when outliners are present. A box plot is much more effective to visualize the data.
Between the minimum and the maximum cell voltage the quartiles Q1 (p25), the median (p50) and the Q3 (p75) values are calculated and displayed:
Example of a very well balanced battery:
Voltage Distribution (dV= 26 mV):
*-------------------------------->-[]-<-*
4132   03 > [4155; 4155; 4156] < 01  4158
min         [p25; median; p75]        max
Example of a badly balanced battery:
Voltage Distribution (dV= 101 mV):
*-----------------[========|======]-----*
3978   00 > [4024; 4048; 4064] < 00  4079
min         [p25; median; p75]        max
Within the Q1
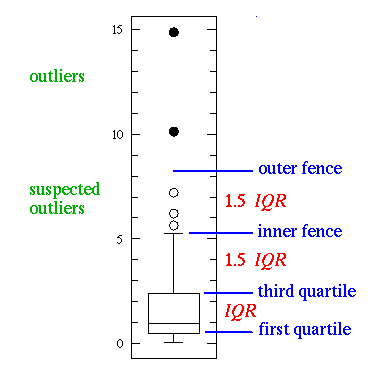
[and Q3]quartiles are 50% of the voltage values. In this interval the median|will be displayed. The upper and lower whiskers-represent the lower and upper 25% of the data including outliners, that are only counted, but not visualized in the graph.Outliners are defined to be outside the 3 times IQR interval (IQR = Q3 - Q1). Suspected outliners are outside the 1.5 times IQR interval. This range is used to calculate the number of outliers under and above in the whiskers, excluding the minimum and maximum values.
Example for outliners evaluation:
Voltage Distribution (dV= 31 mV):
*-------------------->-------[==|=]-----*
3500   08 > [3523; 3525; 3527] < 00  3531
min         [p25; median; p75]        max
The lower
>and upper<interval is visualized when it´s in the range of the graph. Only the count of voltage values (here08in the lower andnonein the upper) is displayed, due to the low resolution of the ASCII-scale (40 points are used). So in the example eight voltages are off-value in the lower whisker and are suspectable outliners that are not very well in the range of the IQR window.For further information about box plots see:
Find a detailed look into the charger behaviour here.
-
Voltage and Current Readings
EVSE status: 32 A, State: C
Cable code : 220 Ohm
Charger max: 20 A, State: CHG
List the maximum current the EVSE is capable of and the pilot signal status (regarding J1772 standard).Cable codeindicates the measured resistor-config between PP-PE. The third value shows the maximum current of the charger and the actual state.The charger will show some realtime measurements during charging:
AC L1: 229.4 V, 18.5 A, 50 Hz
AC R1: 2.11 kW, R2: 2.13 kW, max: 6.83 kW
Single phase data of the mains connection. Within the charger are two 'rails' for the AC/DC conversion.R1, R2will indicate the power transferred in each rail. The max. power usable by design is also shown.DC HV: 395.5 V, 10.0 A
Voltage and current reported in DC circuit (battery and DC/DC, other HV-systems).DC LV: 13.5 V
On board voltage of 12V-system (measured by charger). -
Temperatures
In : 8
Intern.: 11
Out : 10
Coolant: 10
The charger will report temperature measurements of the unit in °C. The intake, outlet, max. internal temperature and the cooling loop value are monitored.
The car is equipped with a mobile communication module (3G type) to send status information for a vehicle homepage to Daimler servers. Find some data about the status:
Date/Time : 2018/2/24 16:00:00 UTC
Date and Time in UTC format.
RSSI : -85 dBm, 30%
Reception level in dBm and signal strength in percent (These are assumptions correlated to measurements with a similar PCB antenna and my own test receiver near the TCU):
State : CN
Status: OFF, ON, CN (connected).
NetType : 3G
Network type of connection. By reviewing the emission of the TCU with spectral analysis via network test equipment.
Network : limited
Provider data (name, just in ASCII ;-) ).
SMS count : 14
Count of wake up SMS from Daimler servers e.g. for preconditioning (Assumption!)

