-
Notifications
You must be signed in to change notification settings - Fork 6
Validation
Beyond simple unit tests, models implemented in smelt are also
validated to ensure they are able to produce reasonable results for
the scenarios they were designed for. The following sections present
validation results for stochastic models currently implemented in
smelt.
Predictive model for site specific simulation of ground motions based on earthquake scenarios - Vlachos et al. (2018)
This model is based on the work presented in Vlachos et al. (2018). This model allows users to generate synthetic seismic ground acceleration time histories for specific scenarios based on regression relations developed using a subset of the NGA-West2 database. The model takes as inputs the moment magnitude, closest-to-site distance, and average shear-wave velocity in the top 30 m at the site of interest.
The first step in the validation of the smelt implementation was to
verify that the correct power spectrum is produced for the two cases
shown in Vlachos et
al. (2016). In
this work, two non-rotated NGA ground motion records are utilized to
generate the entire set of fitted model parameters. By directly
setting these model parameters, the power spectrum generated in
smelt using the bimodel Kanai-Tajima power spectrum described in
Vlachos et al. (2016) can be directly compared to the power spectre
presented in Vlachos et al. (2016).
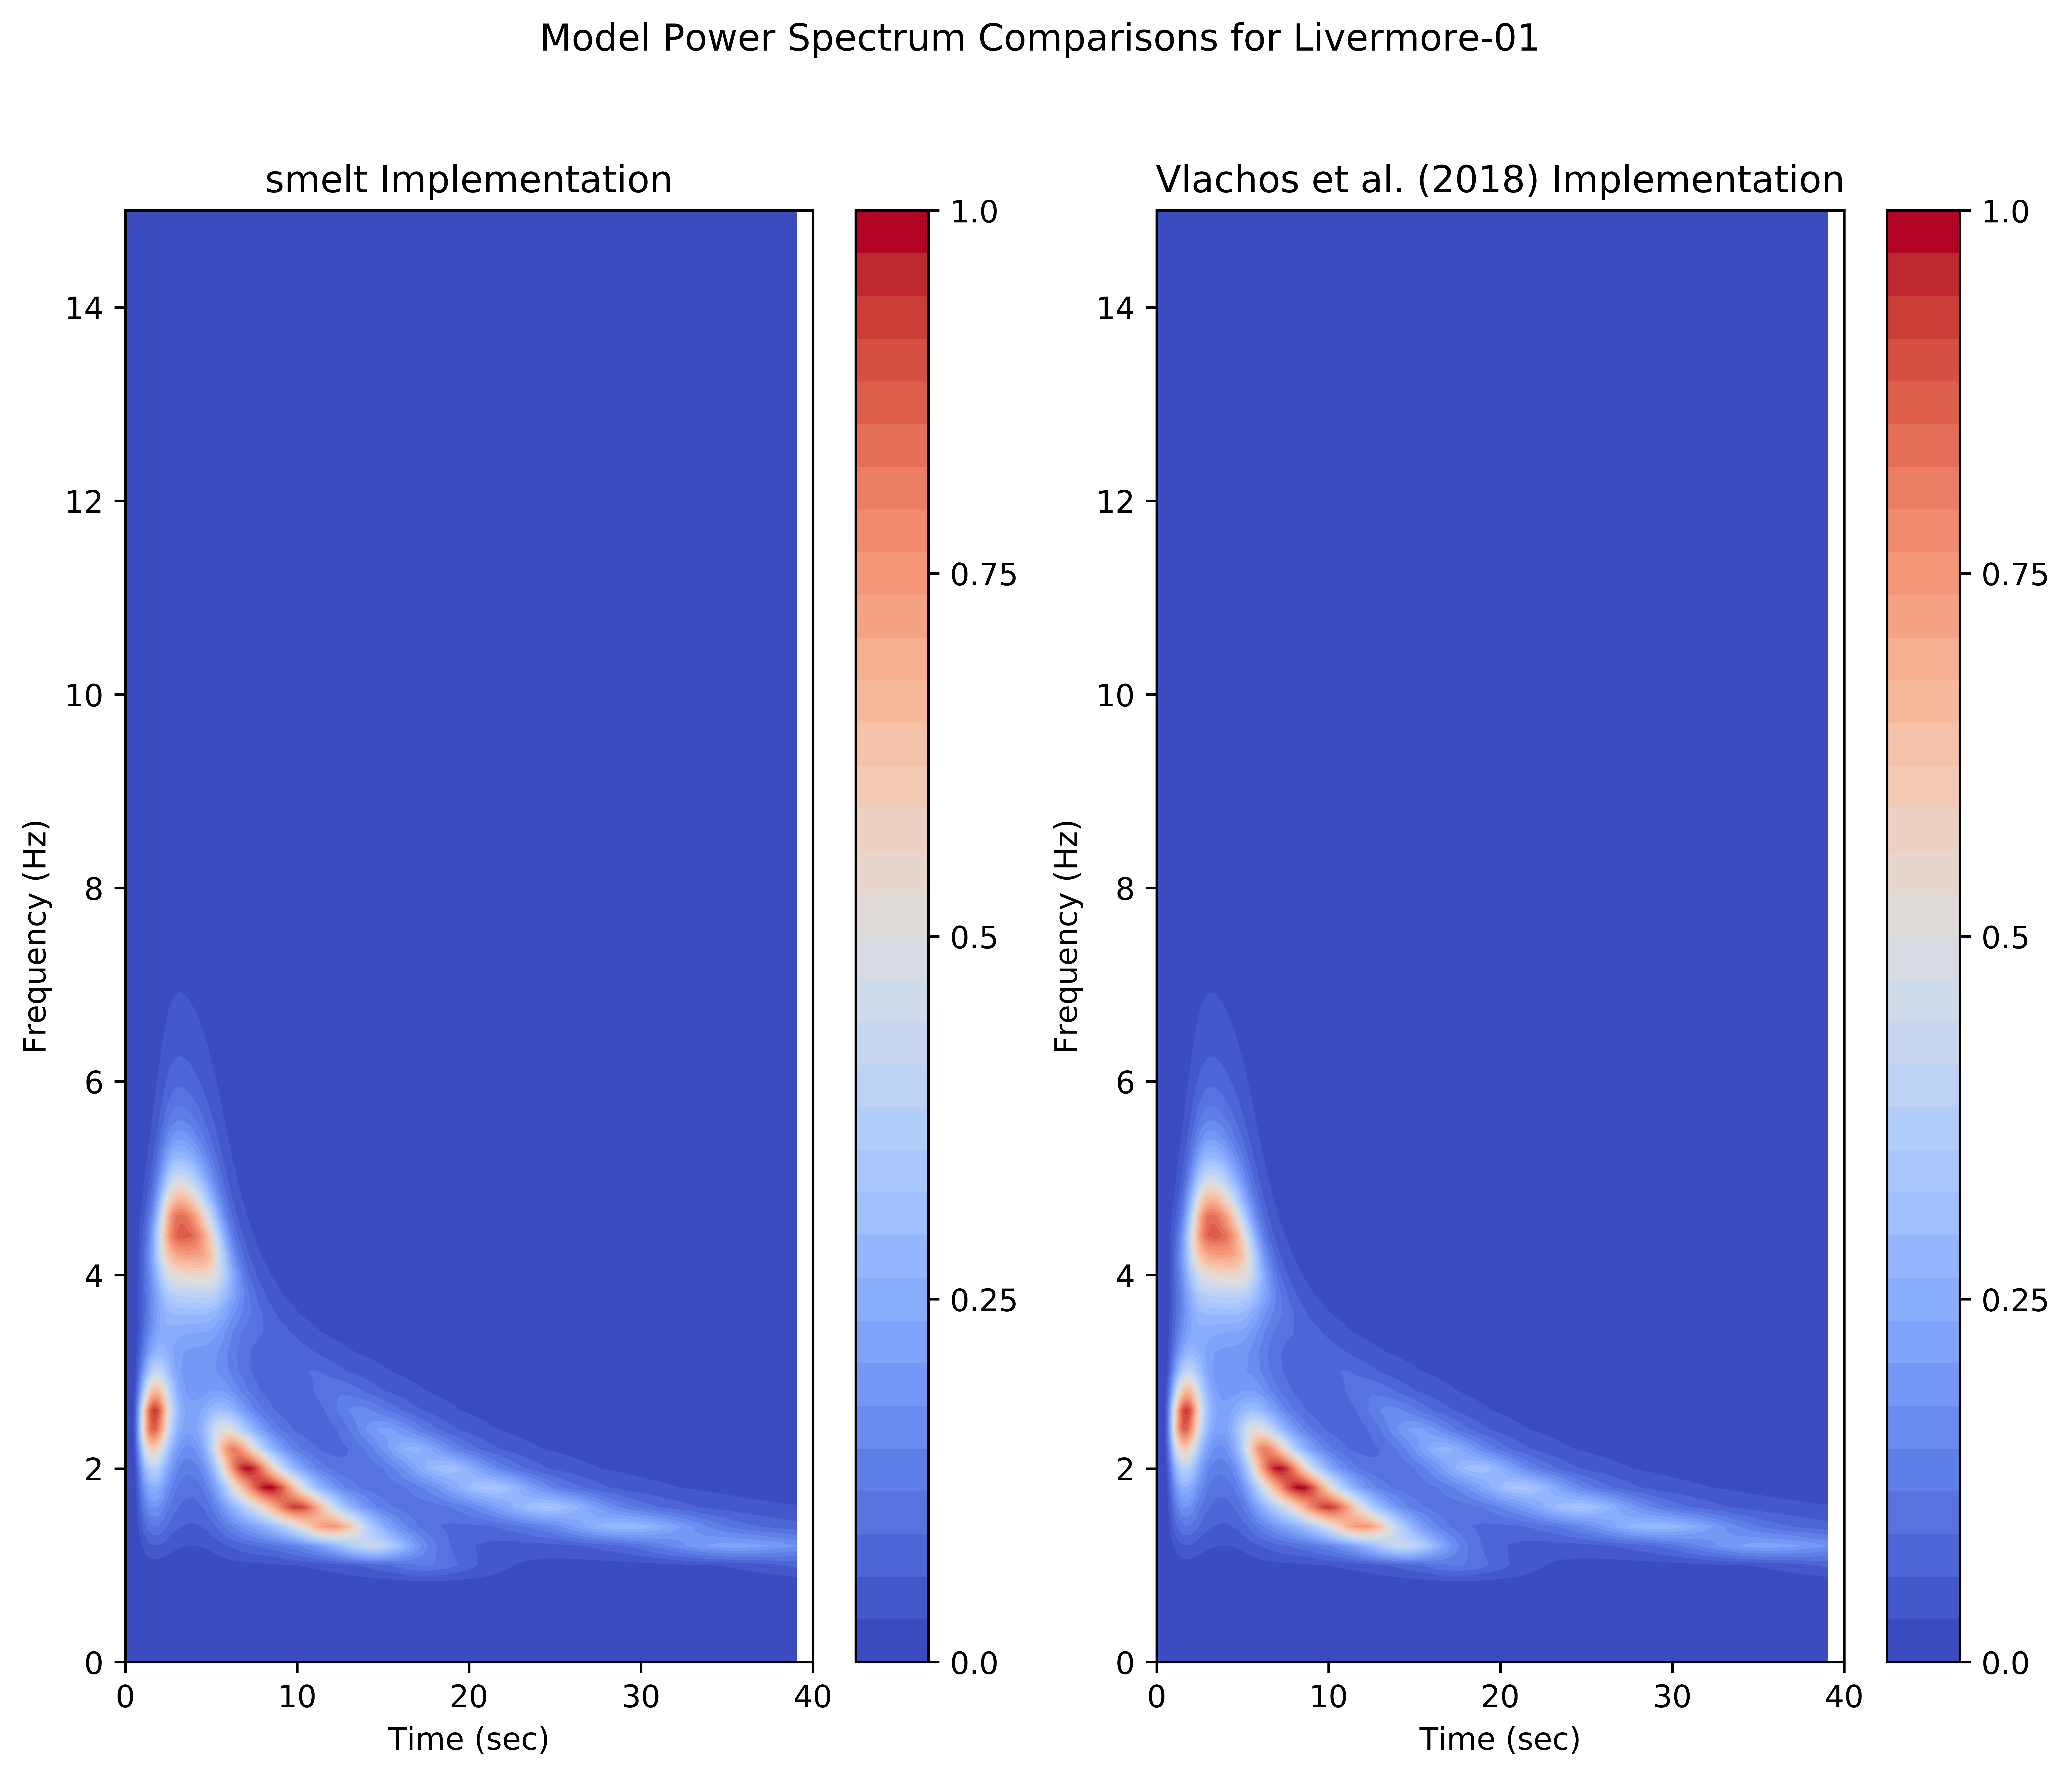
The two NGA records used were the component 70 of the San Ramon First
Station recording (NGA Sequence Number 215) of the Livermore-01 1980
earthquake, and the component 320 of the Cholame-Shandon Array # 8
recording (NGA Sequence Number 31) of the Parkfield 1966
earthquake. The figure below shows a comparison of the power spectra
generated using the smelt implementation of the Vlachos et
al. (2018) model and the MATLAB implementation provided by Professor
K. G. Papakonstantinou, from Pennsylvania State University, who is a
co-author on both Vlachos et al. (2016) and Vlachos et al. (2018). In
both cases, the model parameters were set to the values specified in
Vlachos et al. (2016) for the Livermore-01 record. As can be seen in
this figure, the generated power spectra are practically identical and
are consistent with the estimated power spectra presented in Vlachos
et al. (2016).

Similarly, the plot below shows the comparison of the power spectra
for the Parkfield record generated using smelt and the MATLAB
implementations. Again, the power spectra are identical and are
consistent with estimated power spectra presented in Vlachos et
al. (2016).

next step in the smelt implementation validation was to compare the
simulated ground motion time histories against both the MATLAB
implementation as well as the NGA-West2 ground motion prediction
equations (GMPEs). Given the stochastic nature of the simulations, the
only way to check the implementation was by considering an ensemble of
generated motions. In order to do this, the 5% damped elastic
response spectra from the ensemble of ground motions generated by
smelt was compared to the response spectra from motions generated
using the provided MATLAB implementation as well as the response
spectra given by the NGA-West2 GMPEs.
The figures below show the mean +/- one logarithmic standard deviation
for 1000 synthetic ground motions generated using the smelt
implementation (shown as the red lines in all plots). These are
plotted together with an ensemble of 1000 synthetic motions generated
using the MATLAB implementation (shown as green lines in all plots). The
GMPE spectra are based on the geometric mean of the four NGA-West2
models that account for site soil conditions and are shown as the blue
diamonds in all plots. As can be seen in the figures below, the
smelt implementation is in excellent agreement with the MATLAB
implementation and in very close agreement with the estimates provided
by the NGA GMPEs.


Simulating wind velocity fluctuation using discrete frequency function and fast Fourier Transform (FFT)- Wittig & Sinha (1975)
This model is based on the work presented in Witting & Sinha (1975). It allows users to generate time histories of fluctuating wind velocity. This is accomplished by generating discrete frequency functions which correspond to the Fourier transform of the time history of the fluctuating component of the wind velocity. The time history is then obtained by applying the FFT algorithm to the discrete frequency functions. As inputs, the model requires the exposure category based on ASCE 7, the 3-second gust wind speed, the number of heights at which to calculate the wind velocity time history, and the total height to be considered.
To verify that the stochastically generated wind velocity time histories match the target event, the power spectral density of the generated time histories is compared to the analytical spectral density based on the Kaimal wind spectrum model (Kaimal et al (1972), Simiu & Scanlan (1996)) and the Davenport coherence function. In this validation example, the 3-second gust is set to 30 miles per hour, the exposure category is D, and time histories are generated at three different heights. Estimates of the power spectral density are compared to the analytical values, as shown in the two figures below. The first figure shows the auto correlation for the first height while the second figure shows the cross correlation between the second and third heights. As can be seen in these two figures, the two different results show very good agreement between the theoretical Kaimal values and the estimates based on the generated stochastic wind velocity time histories.

