Gaps between buildings #19
Comments
|
Why are you not using the outlines for the final geometry? Just an idea - I havent actually looked into or tried the implementation yet: |
|
@RobJN fits in the tool indeed! ideally, the vectorizer would ensure adjacency of buildings (within a certain threshold) but I had little time and ability for this. I have found some work on this area [1] but no implemented code. [1] http://www.sciencedirect.com/science/article/pii/S0097849311000033
|
|
@hjanetzek that's a different approach to the same problem (from lines vs from fills). we did the latter approach. the line approach could be interesting to pursue.
|
|
I've posted a question on StackExchange about this at http://gis.stackexchange.com/questions/97909/how-to-extract-vectors-from-a-map (which includes a link to my example files in Google Drive). No suggestions so far, but I just stumbled across the Strava Slide work of @paulmach which I've had open in a tab since State of the Map US 2014. Perhaps we could see if we could use that (substituting GPS data for pixel "blackness" in the unprocessed geotif). This would bring the terrace buildings together in most cases - any remaining small gaps would just be "slivers" that can be solved using existing GIS tools. I'll contact Paul in the morning. p.s. I've now got a PDF copy of that research paper. They suffer the same problem of gaps between buildings and attempt to solve it by assessing points pairwise. If they are sufficiently close then they are both moved to the midpoint between then (thus snapping the corner of the building together). They note that this would need further developing to deal with 4 buildings that share a corner (i.e. a cross "+" in the original map). |
|
I leafed through the paper but since I didn't see any code I decided to ignore it... interesting to see they still did not manage to solve all of it... it is a hard problem indeed |
|
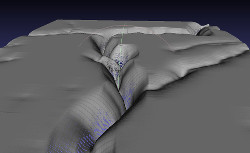
Re: Strava I think this assumes we know the convergence line (the green line in the example). This line could be inferred from the black lines in the original map. A quick search for such a process resulted in this paper. Could be an option. Worth thinking about... |
|
Re: Strava Well the green line is the line at the bottom of the valley in the "surface" plot [1]. It's what the Slide tool outputs. Strava are currently using their GPS data to create the surface plots, but I think we could use pixel "blackness" in the original map scan. So essentially we create initial building polygons using the NYPL tool. Create a surface plot based on pixel blackness, and then use Strava's tool to "slide" the building polygon down the valley of the surface plot. Finally we load it into the crowd sourcing website to verify and correct any errors. Thanks for the link - I'll take a look. |
The vectorizer traces around the inside of the building wall. As such on a terraced street you end up with a small gap between all buildings. I am after some ideas of how to fix this:
The text was updated successfully, but these errors were encountered: