KEYWORD:
Vector, Raster, Urban Data, GIS, Data Processing, Data Mining, Machine Learning, Artificial Intelligence, Visualization, Mapping, Design Decision-Making ...
SHORT DESCRIPTION:
This course contains several introductory lectures and hands-on workshops for those who want to use data as design materials to develop the design process.
We will gently visit the basic concepts and implementations of the topics: Code, Data and processing, Geometry data, Vector, Raster, and some machine learning models and their related technologies, such examples: Regression, Classification, Pattern, Data Representation, Dimensionality Reduction, Machine Learning, Deep Learning, Implementation, Mapping, and Visualization Methodologies.
From the designer's perspective, students will better understand and implement the use of data and tools, finally, gain holistic high-level concepts to expand that knowledge and technology further. Therefore, the ideas and contents you will learn in this course could become a map for those who want to learn how to use data and digital media in design.
Each day, students will learn the individual topics listed below. Then, students will make a group to discuss, help, understand, and finish homework and examples. All code and examples will be online, and the instructor will be available before and after class for troubleshooting.
In addition, it is also possible for an individual or group to focus on one of the primary topics and revisit other topics after the course based on the student's ability and expectations. It is yours if you are interested in data as a design material.
DELIVERABLES:
Class materials and homework
LOCATION:
Gund Hall Room 520
DATE:
TUE(03), WED(04), THU(05), FRI(06), Mon(9), January 2023
TIME:
3PM ~ 5PM(EST)
20% for lectures, 70% for workshops, and 10% for exercise and troubleshooting
TOOL
Programming Language: Python(Anaconda), Typescript(Javascript)
Library: NJSCore, Numpy, Pandas, Tensorflow, TensorflowJS
Software: Visual Studio Code, NodeJS, Github Desktop
PARTICIPANTS
Up to 10 students
Prerequisite
Experience with one of modern programming languages(Python, Java, Javascript, Typescript, C, C++, C#, or Swift)

LECTURE - Data in Design
The introduction to the key topic: Data in Design, helps you understand the meaning of using data in the design process through several examples.

WORKSHOP
Data processing, Data Type, Memory, Python, Numpy, Pandas library, ...
As a first step, We will learn the basic concept of programming, dealing with logical flows and data manipulation.
LAB 01 - Python Basic, Condition & Loop, Primitive Data Structure
LAB 02 - File format, Data Structure, object(class)
LAB 04 - Matrix, Numpy basic
LAB 05 - Pandas basic

LECTURE
Understanding the tool for qualification and quantification is crucial for using data as design material. We will learn basic design and how to decompose design elements as vector and raster data. In addition, it can allow us to think and set up the design process.

WORKSHOP
LAB 01 - Vector Data, Vector Point,
LAB 02 - Line, Polyline, Polygon,
LAB 03 - Mesh,
LAB 04 - Raster Data, Image, Matrix,
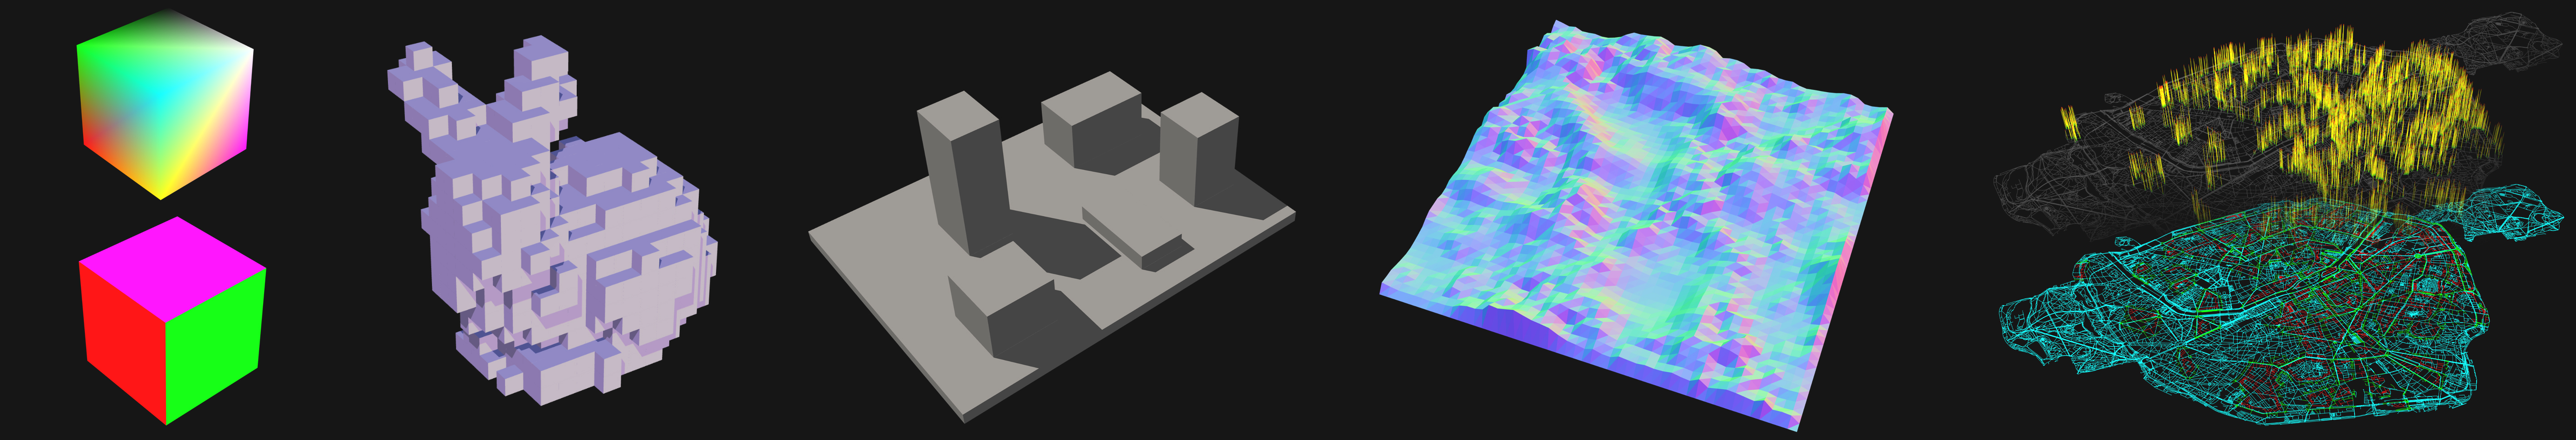
LAB 05 - Color, Pixel, Voxel
LAB 06 - Web implementation: Point, Line,Interactive Polyline, Polygon, Mesh, Geometry as data structure, Pixel map, Graph and Voxel map

LECTURE
Regression, Classification, Machine Learning, Deep Learning
We will gain a high-level understanding of AI in design: Supervised and Unsupervised Learning and related models. Students will go through several examples, enabling us to expand the use of models in design processes.
WORKSHOP

Tensorflow, Keras, Numpy, Pandas, and other libraries
LAB 01 - Temperature conversion
LAB 02 - Multiplication table
LAB 03 - Smart Drawing
LAB 04 - Digital Texture prediction
LAB 05 - Map Classifier
LAB 06 - Data Reference(Vector & Raster) & Basic Models(Regression & Classification: Linear Regression, Ridge, Lasso, ElasticNet, Naive Bayes, Polynomial Regression, KNN, Logistic Regression, Decision Tree Classifier, SVM, ANN, CNN)
LAB 07 - Examples - Map classification, GAN ...
LAB 08 - Web implementation(TensorflowJS: Regression, Classification, SmartDrawing, t-SNE, Image, Video)
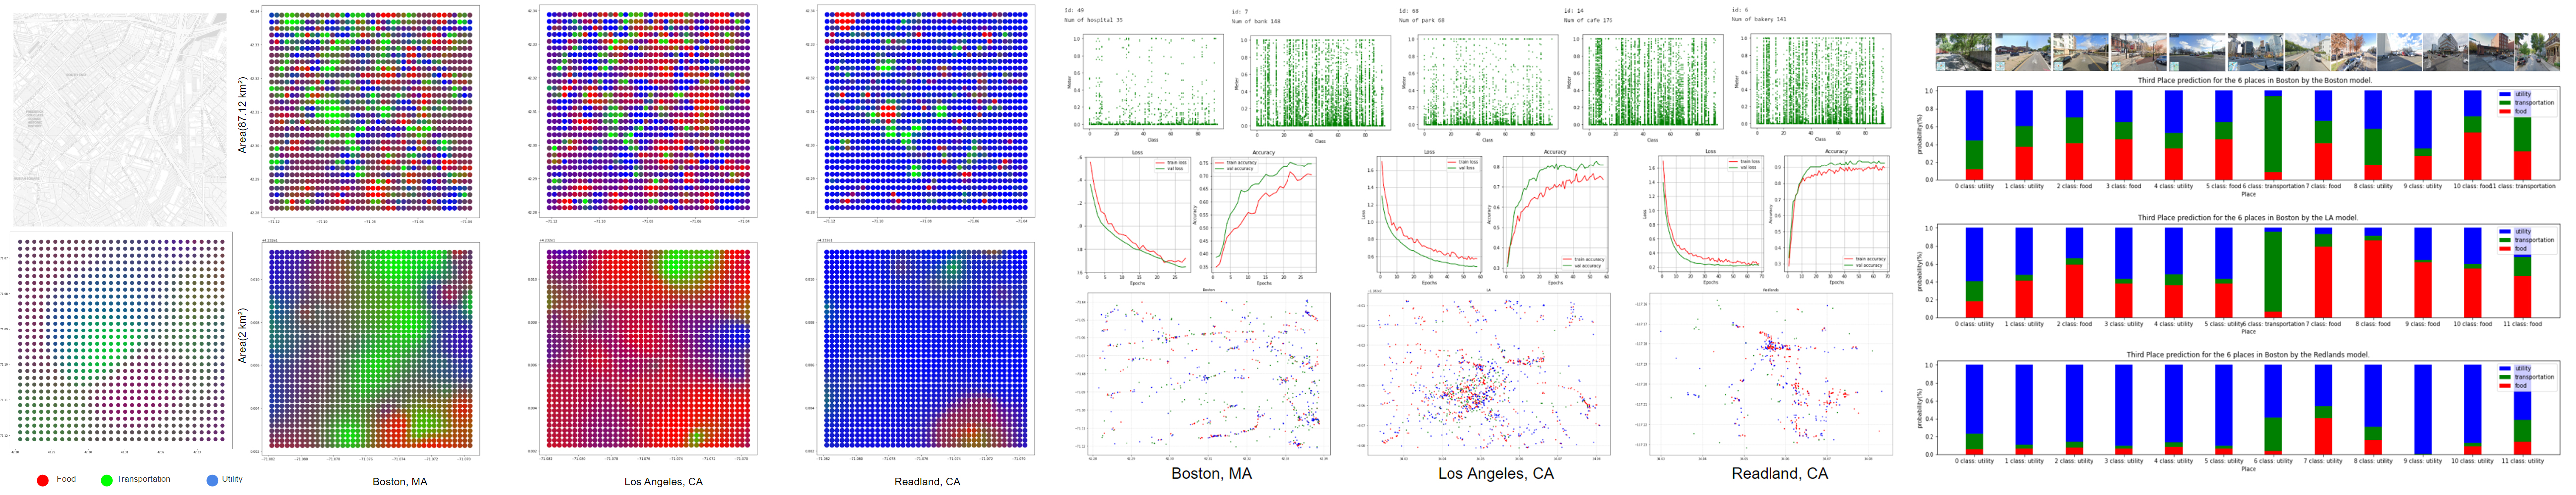
LECTURE : Reading
We will take look the Third Place research(Initial work, Paper, AI Model),
Network Analysis, Dimension Reduction, Cost function, Decay function ...
LAB 01 - Parsing data, Google Place API
LAB 02 - Parsing, Processing, Visualizing Data
LAB 03 - Processing Data For Train
LAB 04 - Training Models
LAB 05 - Network: Distance(Euclidean) and Decay model
LAB 06 - Fitting Network and Implementation
LAB 07 - Networks for Boston, LA, and Redlands

WORKSHOP
LAB 01 - Visualization,
LAB 02 - Model implementation(Boston, LA, and Redlands)
LECTURE
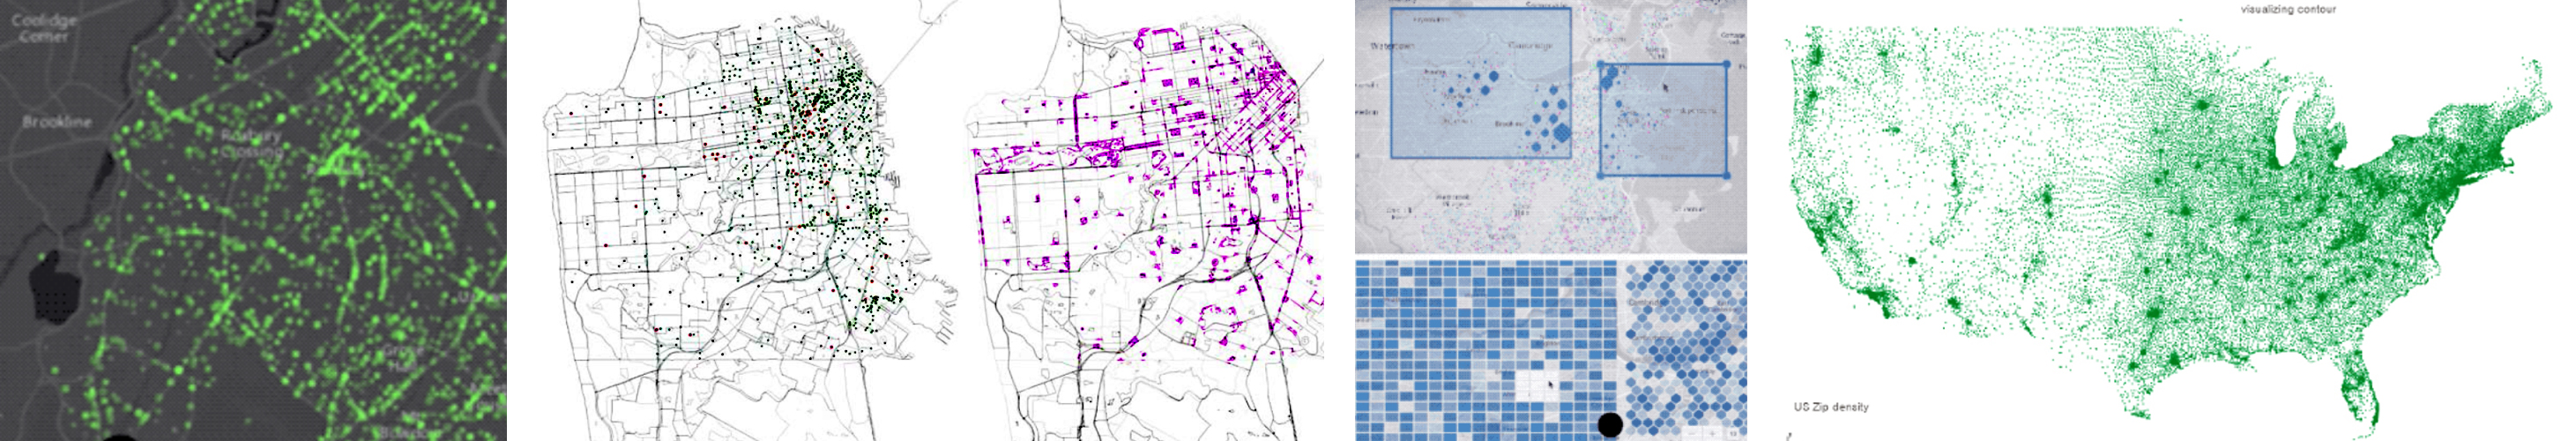
Principles of Graphical Integrity, Visualization, Projection, Generalization
Pipeline for visualization, Mapping, Methodology, and Implementation
Implementing digital mapping and visualization on the web environment, Understanding boilerplate code and the pipeline
LAB 01 - Typescript Basic
LAB 02 - Boilerplate(2D, 3D) code and the pipeline
WORKSHOP
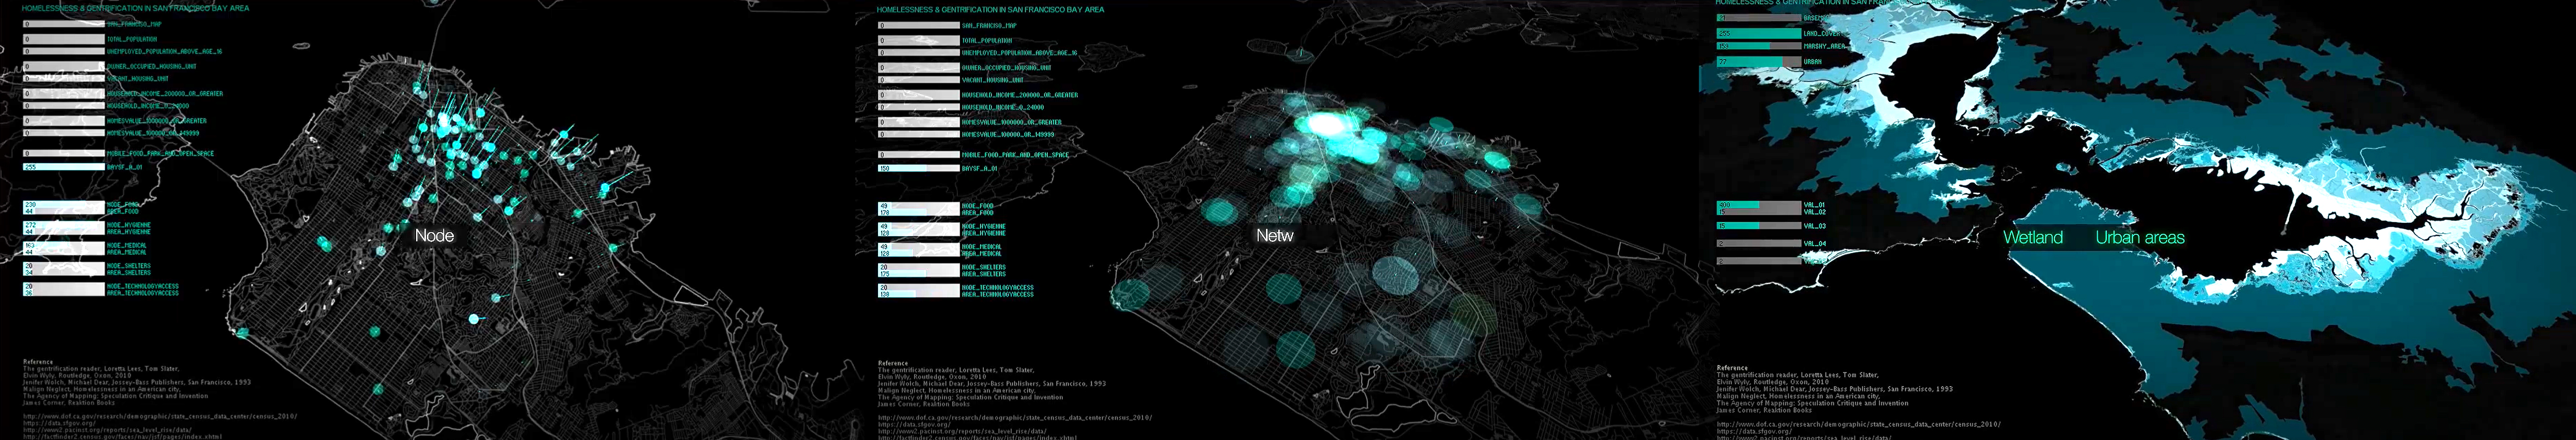
This part is about implementing interactive visualization with urban data and the results from Machine Learning on a web browser. We will examine practical digital mapping techniques such as Bin, Color Blending, and more.
ArcGIS JSAPI / MapboxGL / HTML Canvas / njsCore / Typescript ... Point, Line, Polygon, Interaction, Bin, Color Computation Blending mode using HTML Canvas
LAB 01 - Basic visualization
LAB 02 - Visualization Vector and Raster
LAB 03 - Visualization analysis methods(Bin) and tools(Graph, Network Analysis)
We will learn how to visualize data: vector(Point, Line Polyline Polygon or Mesh) and raster(Image), as a form of geometries with colors on web environment.
WORKSHOP
LAB 01 - THREE JS basic and the pipeline
LAB 02 - Point, Line, Polyline, Mesh (Rhino Grasshopper)
LAB 03 - Slowzone project review
! This schedule could be revised based on the student's expectations and time.
Reference:
Paper: https://www.springer.com/gp/book/9789813343993 https://link.springer.com/chapter/10.1007/978-981-33-4400-6_11
GitHub: https://github.com/NamjuLee/Third-Place-Prediction-Report-V2022
Introduction to Computational Design: Data, Geometry, and Visualization Using Digital Media: https://nj-namju.medium.com/introduction-to-computational-design-data-geometry-and-visualization-using-digital-media-14161fdfd22f
Computational Design Thinking for Designers: https://nj-namju.medium.com/computational-design-thinking-for-designers-68224bb07f5c
yarn or npm install
yarn dev or npm run dev
conda create -n tf tensorflow with CPU or conda install -c anaconda tensorflow-gpu for the GPU version
conda env list
conda activate tf
conda install -n tf ipykernel --update-deps --force-reinstall
conda install pandas
conda install opencv
conda install matplotlib
conda install scikit-learn
conda install Pillow or conda install -c anaconda Pillow
INSTRUCTOR:
NJ Namju Lee / nj.namju@gmail.com
MDes;Harvard, MArch;UCB, B.S;SNUST, Research Fellow; MIT Architecture design, Computation, Visualization specialist, Director and founder of NJSTUDIO and NJSLab Software Engineer and Research and Developer at ESRI
NJ Namju Lee is an architectural designer, researcher, and lecturer. He has been the principal of NJSTUDIO since 2004, specializing in architecture, computational design, and visualization. He graduated from Seoul National University of Science and Technology(B.S), later, UC Berkeley(MArch), and Harvard Graduate School of Design(MDes).
As a researcher, he worked both at UrbanAid Lab at University of Technology, Sydney(UTS), at SENSEable City Lab and Media Lab(Changing Places Group) at Massachusetts Institute of Technology(MIT), and at College of Environmental Design, UC Berkeley. He was invited to workshops and seminars as a lecturer in several universities including Harvard, MIT, Ministry of Labor Korea, and Autodesk Korea, and he taught Digital Design Studio I, II at Sejong University, Seoul, Korea. He published ‘Simulation & Visualization of Architecture’, and contributed some architectural and graphic magazines and tutorials. He has participated in multi-disciplinary exhibitions, the digital film works, and architectural group works in Seoul and Sydney. As a visualization specialist, His collaborators include KPF, HYUNDAI, SAMSUNG, SK, and posco E&C for architectural 3D animation and simulation projects.
He works in the integrative and interdisciplinary domain of built environment and technology, with a particular interest in computational design and visualization. Central to his practice is the use of data as the primary methodology in shaping a design process by integrated computation and visualization.
!This material is for the education and research purpose only, DO NOT use for commercial use or production.