Operations
Hystrix is not only a tool for resilience engineering but also for operations.
This page attempts to share some of what has been learned in operating a system with 100+ Hystrix Command types, 40+ thread pools, and 10+ billion thread-isolated and 200+ billion semaphore-isolated command executions per day.
The screenshots and incidents described on this page come from the Netflix API system and represent either real production issues or Latency Monkey simulations against production.
The typical approach to deploying a new circuit has been to release it into production with liberal configuration (timeouts/threads/semaphores) and then tune it down to a more strict configuration after seeing it run through a peak production cycle.
In practice what this typically looks like is:
- Leave at default the 1000ms timeout unless it’s known that more time is needed.
- Leave the threadpool at its default of 10 threads unless it’s known that more threads are needed.
- Deploy to canary; if all is well, proceed.
- Run in production for 24 hours on the entire fleet.
- Rely on standard alerting and monitoring to catch issues if any.
- After 24 hours, use latency percentiles and traffic volume to calculate what are the lowest configuration values that make sense for the circuit.
- Change the values on-the-fly in production and monitor them using the real-time dashboards until you are confident.
- Only ever look at the configuration for this circuit again if the behavior or performance characteristics of the circuit change and are brought to your attention via alerts and/or dashboard monitoring.
The following diagram represents a typical thought process showing how to choose the size of a thread-pool, queue, and execution timeout (or semaphore sizing):
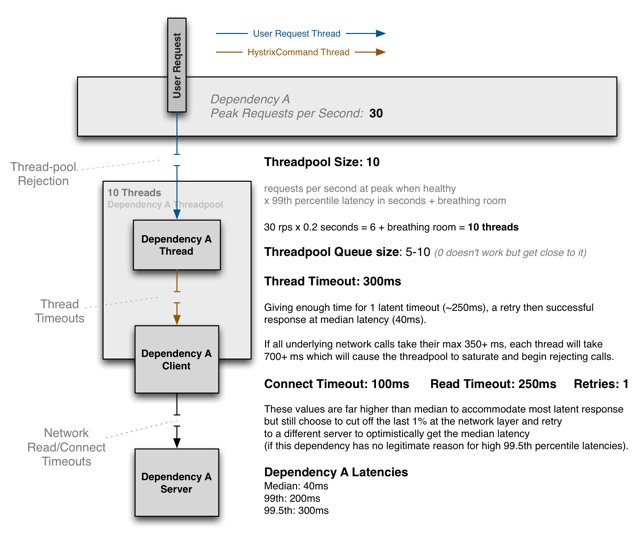
For most circuits, you should try to set their timeout values close to the 99.5th percentile of a normal healthy system so they will cut off bad requests and not let them take up system resources or affect user behavior.
You must size thread-pools and queues so they are a small percentage of overall application resources, otherwise they will fail to prevent a dependency from saturating available resources.
The important things about configuring and tuning circuits are:
- you should do tuning in production and based on real traffic patterns
- you can easily adjust settings in real time while monitoring to see impact of different settings
Hystrix measures and reports metrics with millisecond granularity. This reveals “jitter” — seen as bursts of timeouts, thread-pool rejections, slow downs, and other such things. In a large cluster there are generally some of these things occurring at any particular time for a high-volume circuit.
This granularity at which metrics are captured by Hystrix is something many software systems don’t have, so these reports can cause undue worry.
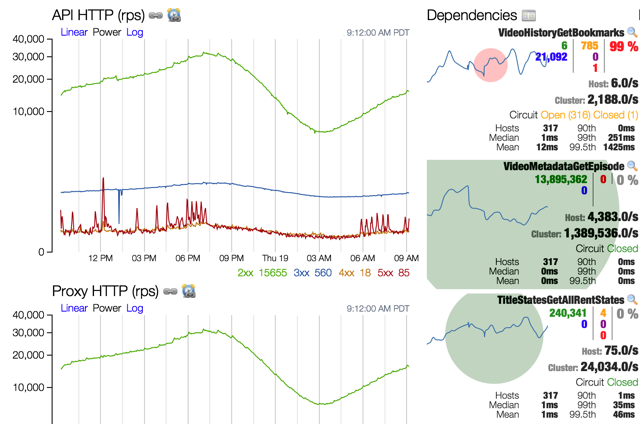
In this screenshot from the Netflix API dashboard that monitors Hystrix Commands in production you can see the orange and purple numbers that show timeouts and threadpool rejections occurring for a small number of requests in a 10-second statistical window representing 243 servers.

Most systems are measured at a fairly high-level — even if broken into percentile latencies it’s done per minute. Also, often it’s done for an entire application request loop, not each individual dependency that is interacted with. In Hystrix you get a much finer-tuned view of what is going on. Once you have the magnifying glass showing you what’s going on with each dependency, don’t be surprised to see jitter that may have been invisible to you before.
Some of the causes:
- client machine garbage collection (your machine does a garbage collection in the middle of a request)
- service machine garbage collection (the remote server does a garbage collection in the middle of a request to it)
- network issues
- different payload sizes for different request arguments
- cache misses
- bursty call patterns
- new machines starting up (deployments, auto-scale events) and “warming up”
If you notice latancy, don’t react by jumping to reconfigure things. If a Hystrix Command is shedding load it’s doing what it’s supposed to (assuming you configured it correctly when it was healthy, of course — see above).
In the early days as Hystrix was being adopted at Netflix it was a common reaction when a circuit (what we internally call a Hystrix[Observable]Command/CircuitBreaker pairing) became latent to dynamically change properties to increase thread-pools, queues, timeouts, and so forth to “try and give it some breathing room” and get it working again. But that is the opposite of what you should do. If you configured the command correctly for a healthy system and it is now rejecting, timing out, and/or short-circuiting then you should concentrate on fixing the underlying root cause.
Don’t make the mistake of responding by giving the command more resources that it can use up (at an extreme if you behave that way, you DDOS yourself by increasing the size of thread-pools, queues, timeouts, semaphores, and the like.)
For example, imagine that you have a cluster of 100 servers each with 10 concurrent connections to a service allowed, that is: 1000 possible concurrent connections. When healthy it normally uses 200–300 of them at any given time. If latency occurs and backs them all up, you are now using 1000 connections. 10 per box may not seem much for the client so let’s try increasing it to 20, right? Most likely if 10 were saturated, 20 will become saturated as well. Now you have 2000 connections held open against the back end making things even worse.
This is one of the reasons why the circuit breaker exists — to “release the pressure” on underlying systems to let them recover instead of pounding them with more requests in retry loops, hung connections, and the like.
For example, here is an example of a single dependency experiencing latency resulting in timeouts high enough to cause the circuit-breaker to trip on about one-third of the cluster. It is the only circuit in the system having health issues and Hystrix is preventing it from taking other resources while it has latency problems.

In short, let the system shed load, short-circuit, timeout, and reject until the underlying system is healthy again and it will take care of itself and come back to health at the Hystrix layer. Hystrix is designed for exactly this scenario and the point is to reduce resource utilization by latent systems so that recovery can occur quickly by keeping most resources isolated and away from those that are hung up on a latent connection.
The most typical type of failure in a distributed system is for a single dependency to fail or become latent while all others remain healthy. In these cases the metrics and dashboards are very obvious in showing what is happening:

The above screenshot shows a single circuit with a 20% error rate: High enough to have impact but not enough to start tripping the circuit breakers. The other three circuits are unaffected.
In this particular example it is actual errors, not latency, that is causing the problem — as shown by the red numbers instead of orange.
The following charts were captured during the same incident to show the historical trend of this circuit and how it spiked in failures and fallbacks.

Here is a screenshot of another incident affecting a single circuit. Note that the 99.5th percentile latency is very high. That’s how long the underlying worker threads were taking to complete, which would in turn saturate the thread pools and lead to time-outs from the calling thread.
All but one machine in the cluster has the circuit breaker tripped, which accounts for most traffic being short-circuited (blue), and on the one machine still trying most requests are being timed out (orange).
Note that the other circuits are healthy and the line graph on the left shows no increase in 500s being returned since this circuit is returning a fallback so users are receiving a degraded but still functional experience.
This screenshot represents a failure (in this case high latency) of a single system that is heavily depended upon by many other systems and so the failure cascaded across them as well. The Netflix API system had to be resilient against latency and failure not from just the single root cause but all of the systems impacted by it as well.
The following screenshot shows six circuits representing three different systems:

At the time of this incident Hystrix was still mostly a “Netflix-API-only” thing. As Hystrix rolls across more and more Netflix teams, this further limits the impact of cascading failure, as this next diagram illustrates:

If all of the circuits seem bad (the dashboard is all lit up) then there’s a good chance the problem is your system, not all of your dependencies at the same time.

Two examples of system problems that can cause this are:
- system is overloaded (high load average, CPU usage, etc.)
- An example of when this can occur is if autoscaling policies fail or don’t scale fast enough with traffic surges, and machines are receiving more traffic than they can handle.
- memory leak that eventually causes GC thrashing which steals CPU and causes pauses which in turn causes circuits to timeout, backup and reject