Looking at results of in-flight collisions (for example, the Iridium/Kosmos event) or various ASAT tests, we seem to end up with an initial dense 'cloud', which later stretches into lines along the orbit. I was curious if I could replicate this in a simple simulation, so I decided to try and code it in Rust. I am completely new to Rust; the code will be bad, but the results are surprisingly interesting, so I still wanted to share this.
The code is trivial; I used a simplified n-body simulation where we only consider the dynamics between a single massive body (Earth) and many smaller ones (the debris), but no debris-debris gravitational interaction. That speeds things up a lot, from around
After the simulation, we can plot everything using a Python script (in results/post_processing.py).
We already get some interesting results. I would like to analyze these, to see the evolution of the shape, mean distances between objects over time. I am also considering adding in an exponential pressure based on the International Standard Atmosphere to make some estimations about decay rates, dependent on the initial orbit height and debris process generation dynamics (i.e. isotropic scattering versus something more directional).
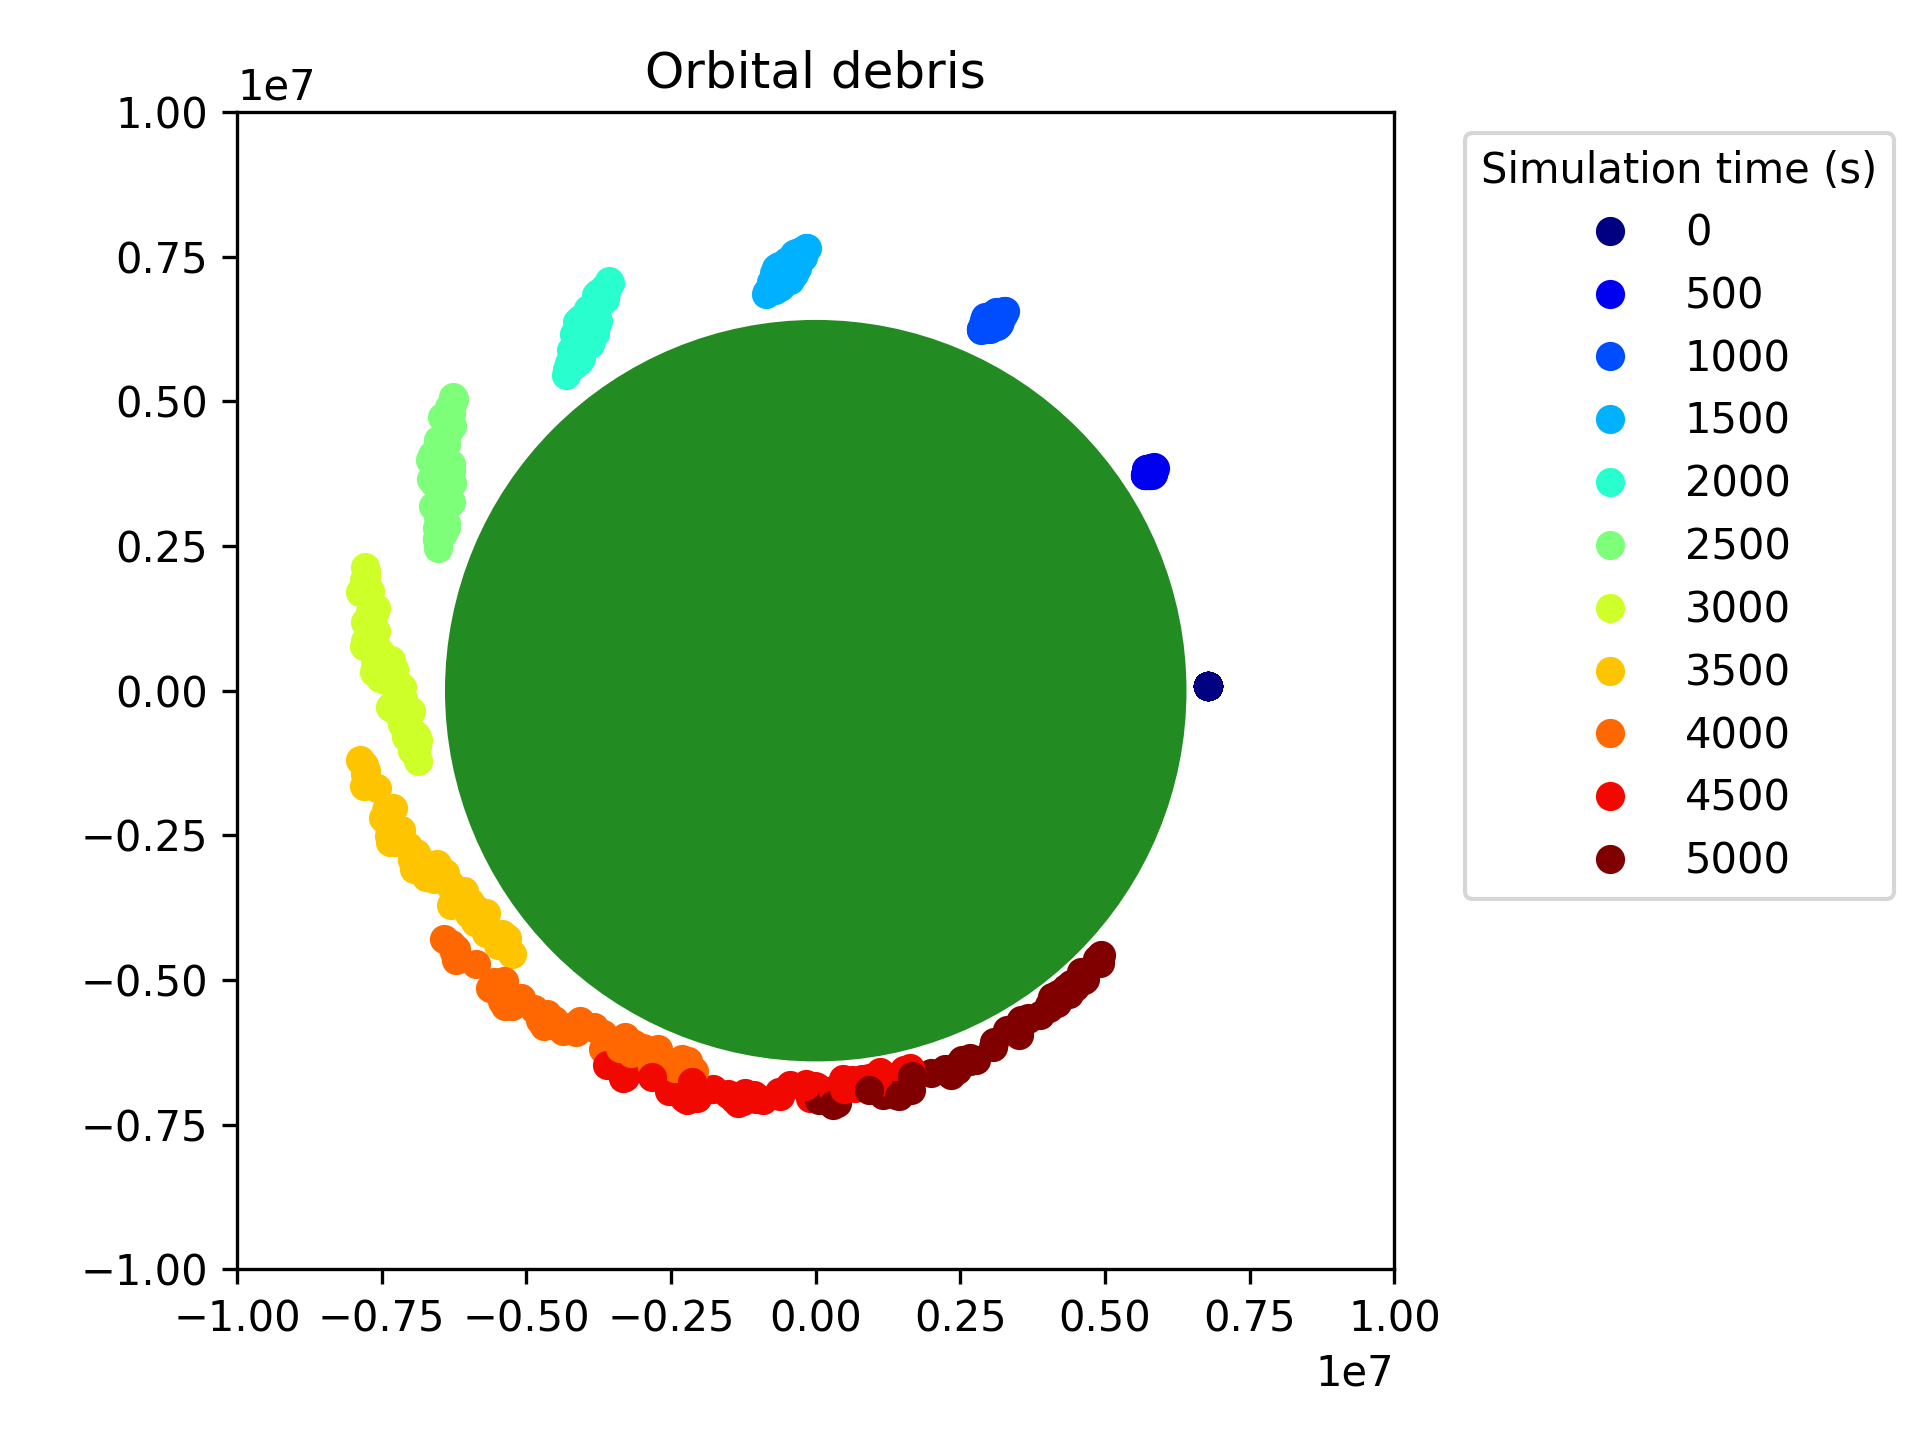
50 pieces of orbital debris, starting with roughly the ISS' orbital parameters, but with random
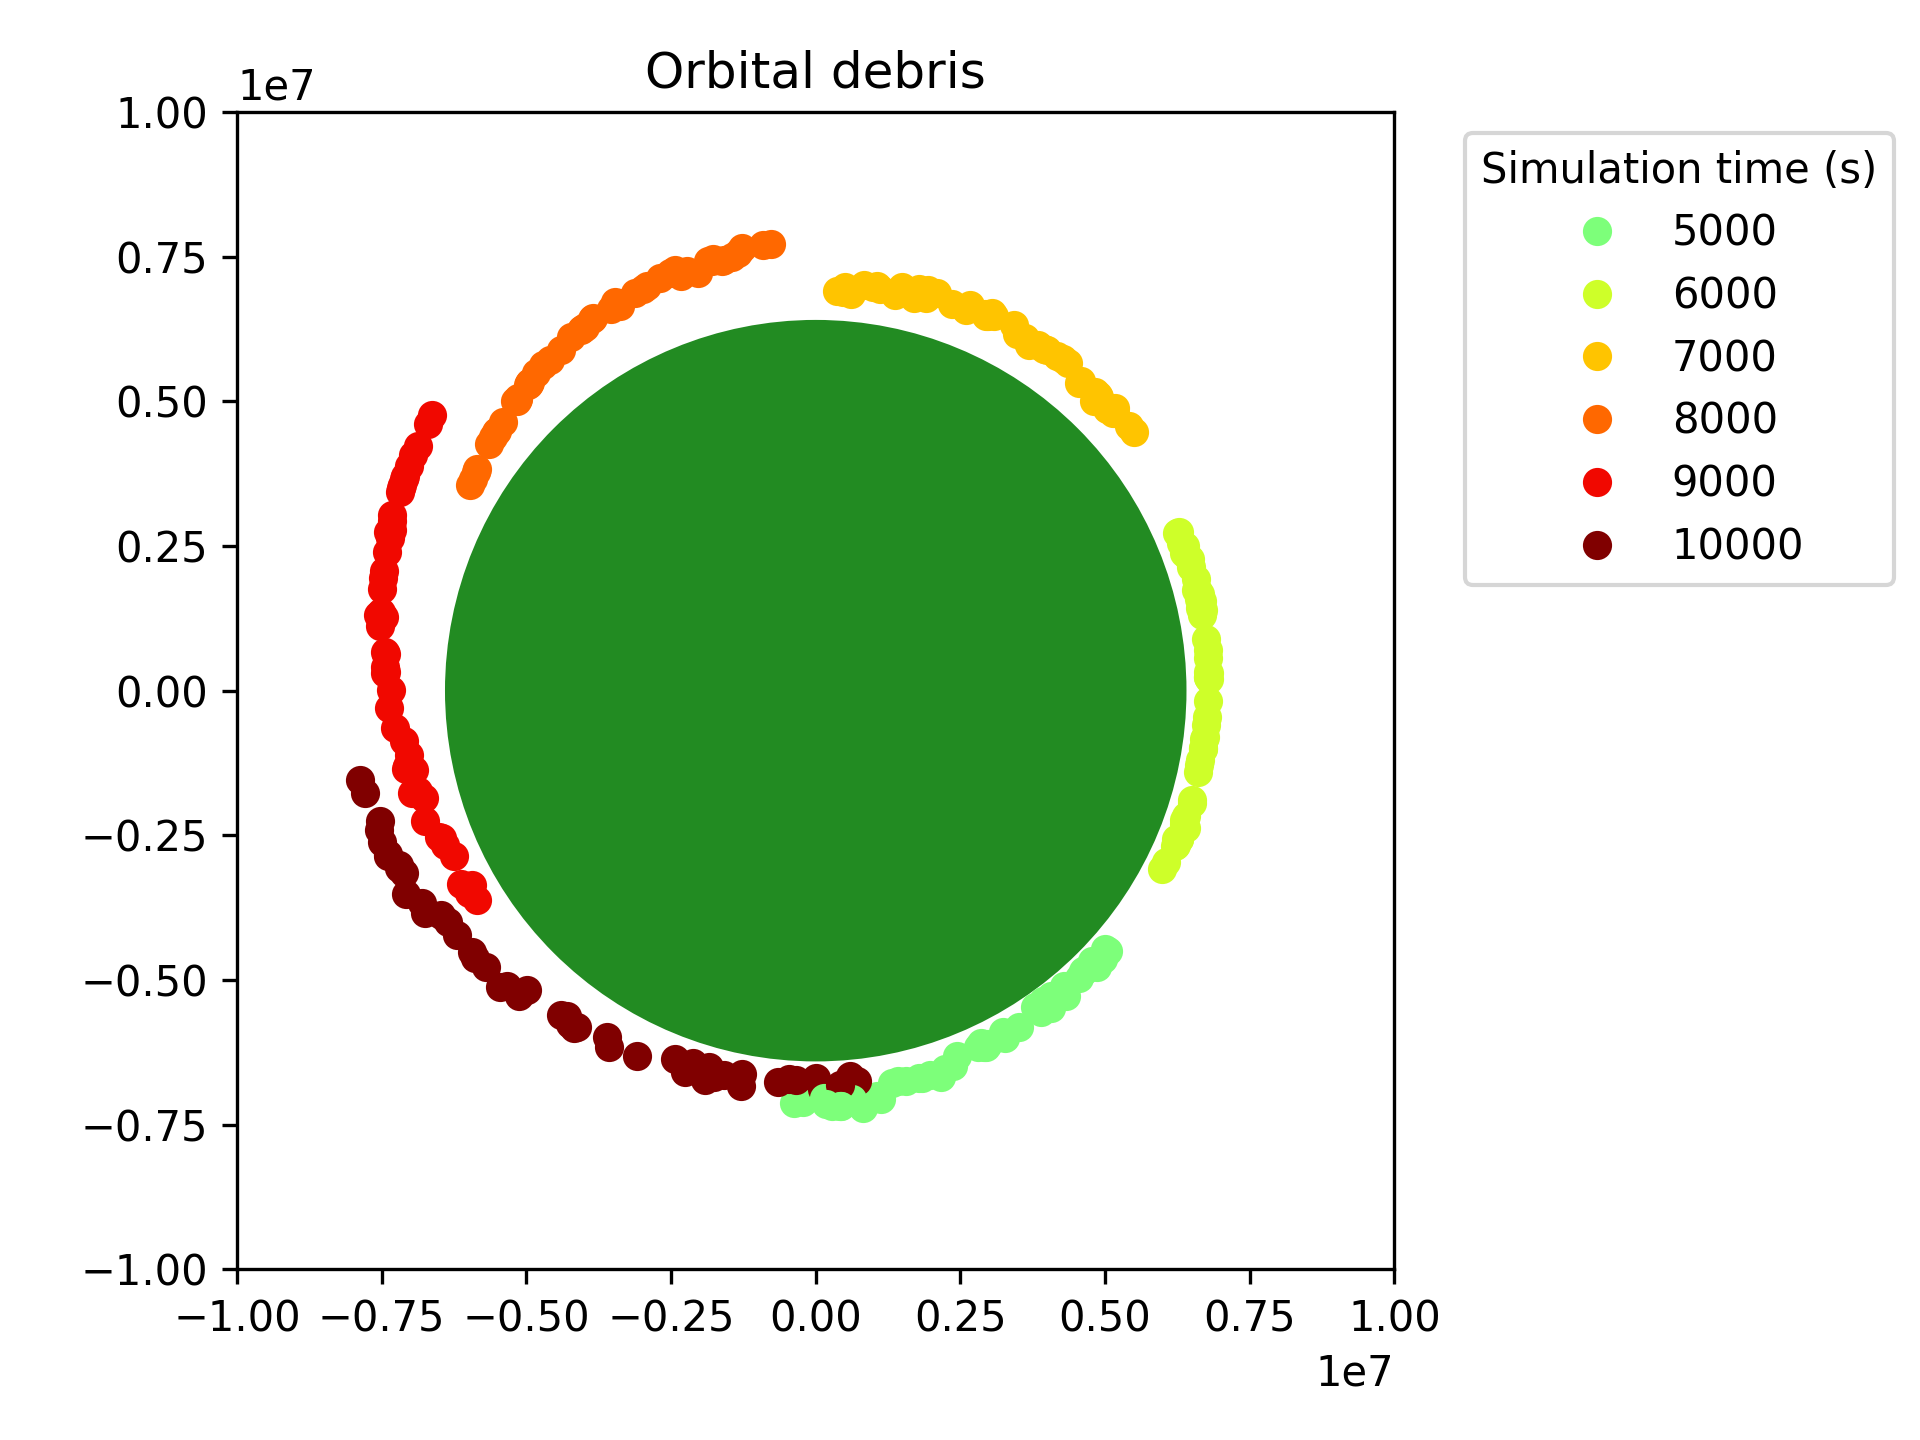
We see the debris starts in a densely packed cloud (500 - 1000), then shifts into highly stretched lines, particularly visible in the second orbit. We can see some of it increases in orbital height significantly, while others get close to the surface of the Earth.