The Deuterium Calculator
Author: Thomas Welborn
Organization: University of Oklahoma
Version 1.3.0
Last Update: January 9, 2020
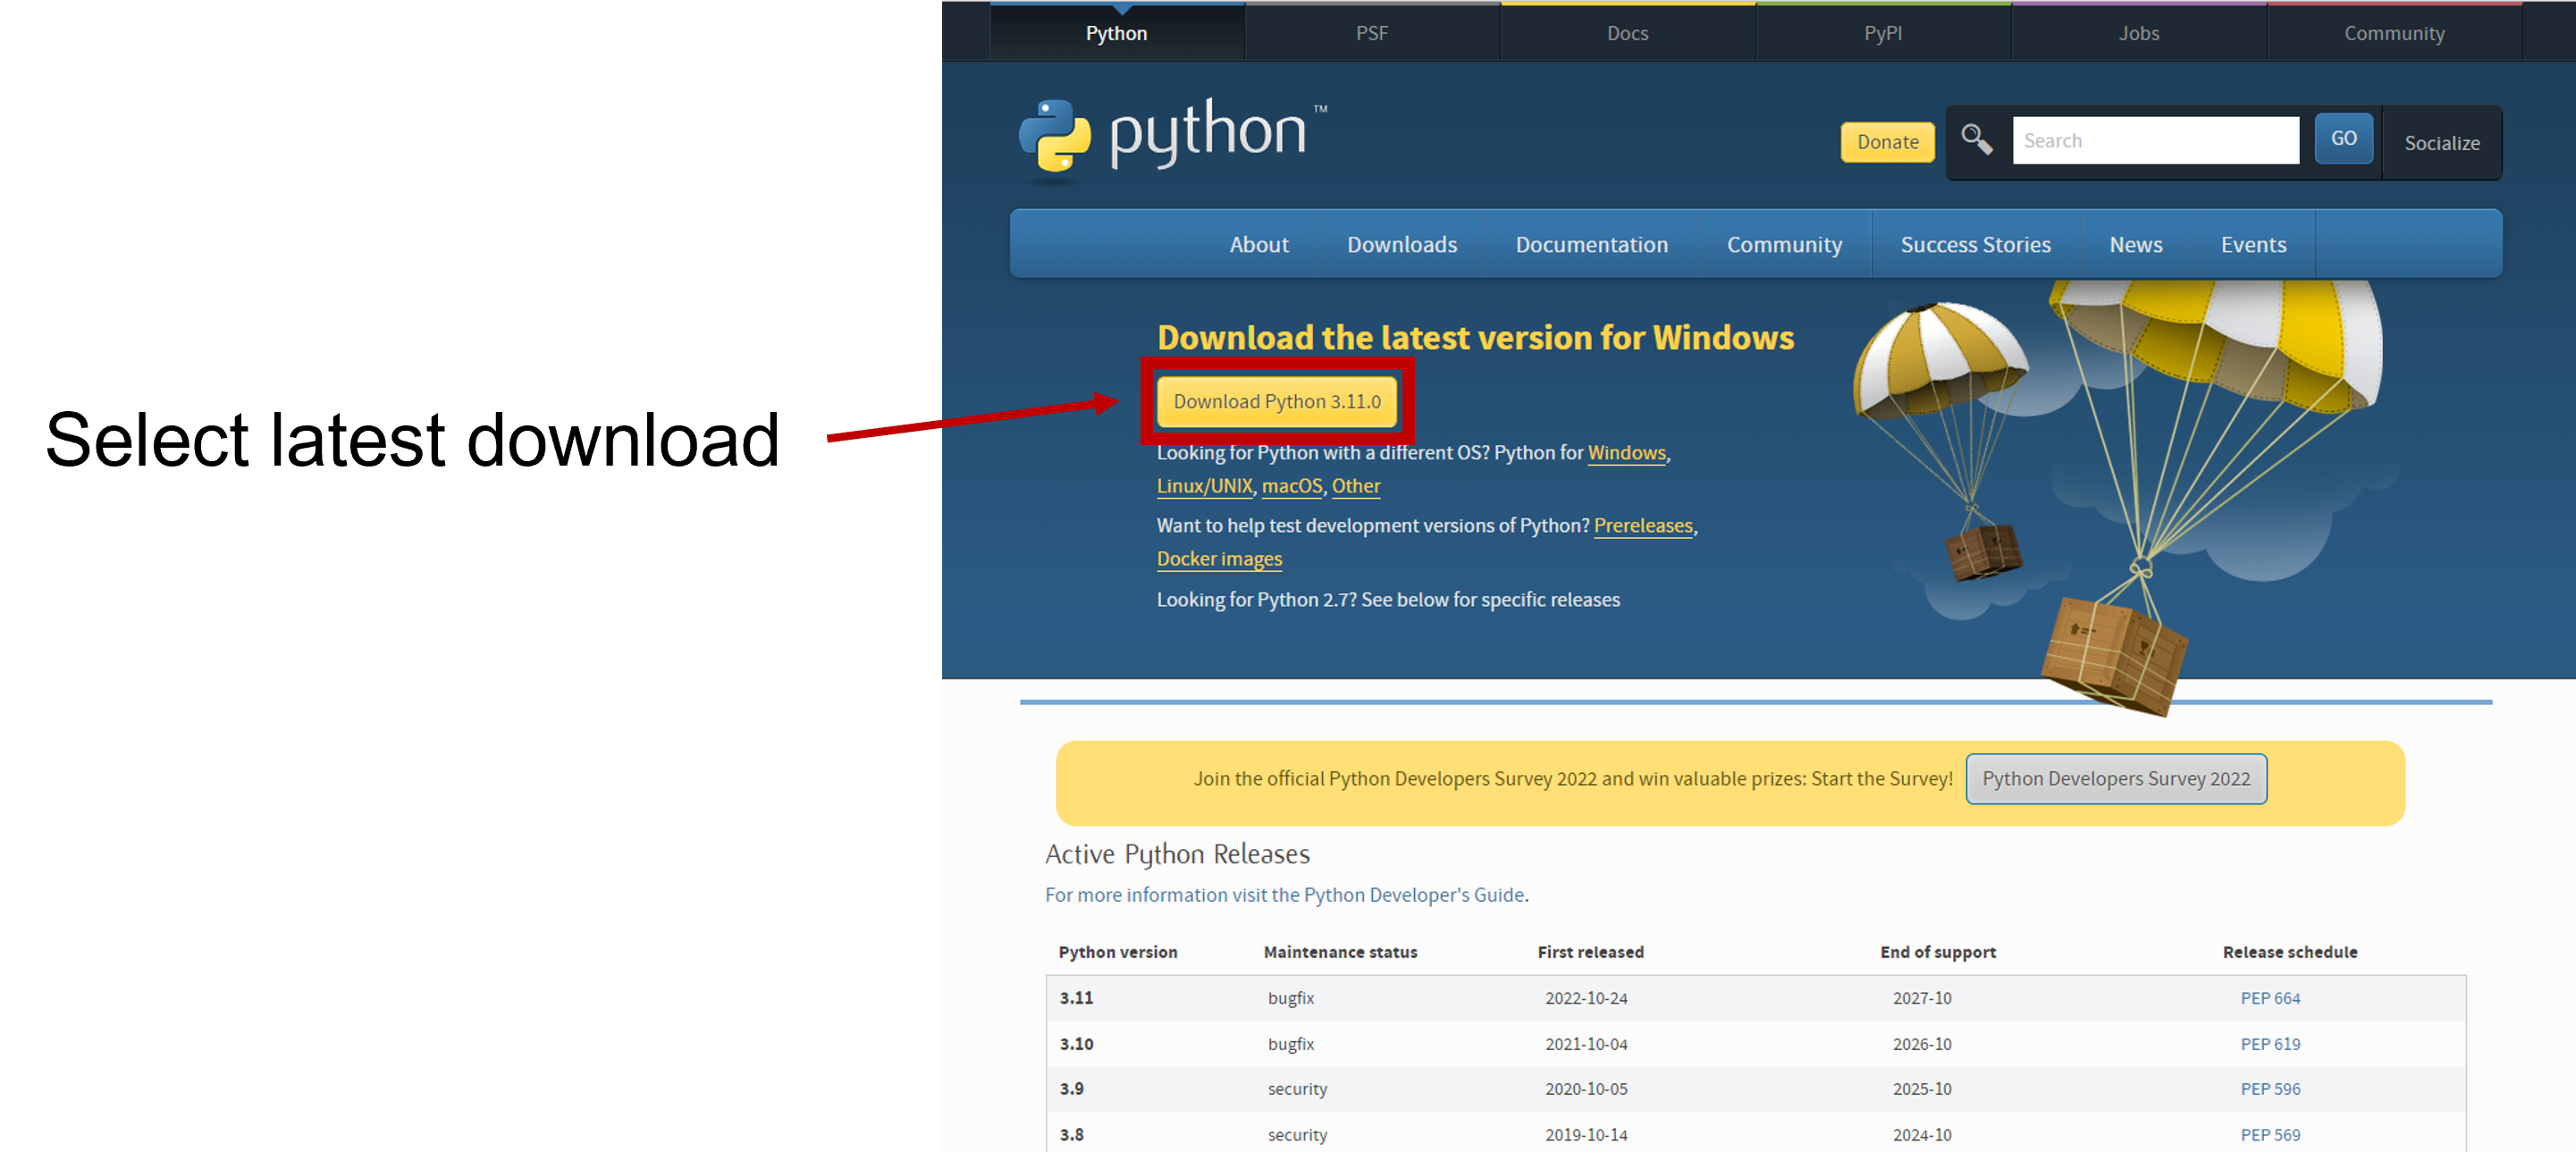
Head over to Python.org to install Python. Currently the supported version is: 3.8.1. If you already have Python installed you may skip this step. It is recommended to update to this version however.
The only change to the settings you need to make is checking the box which adds Python to the Path.
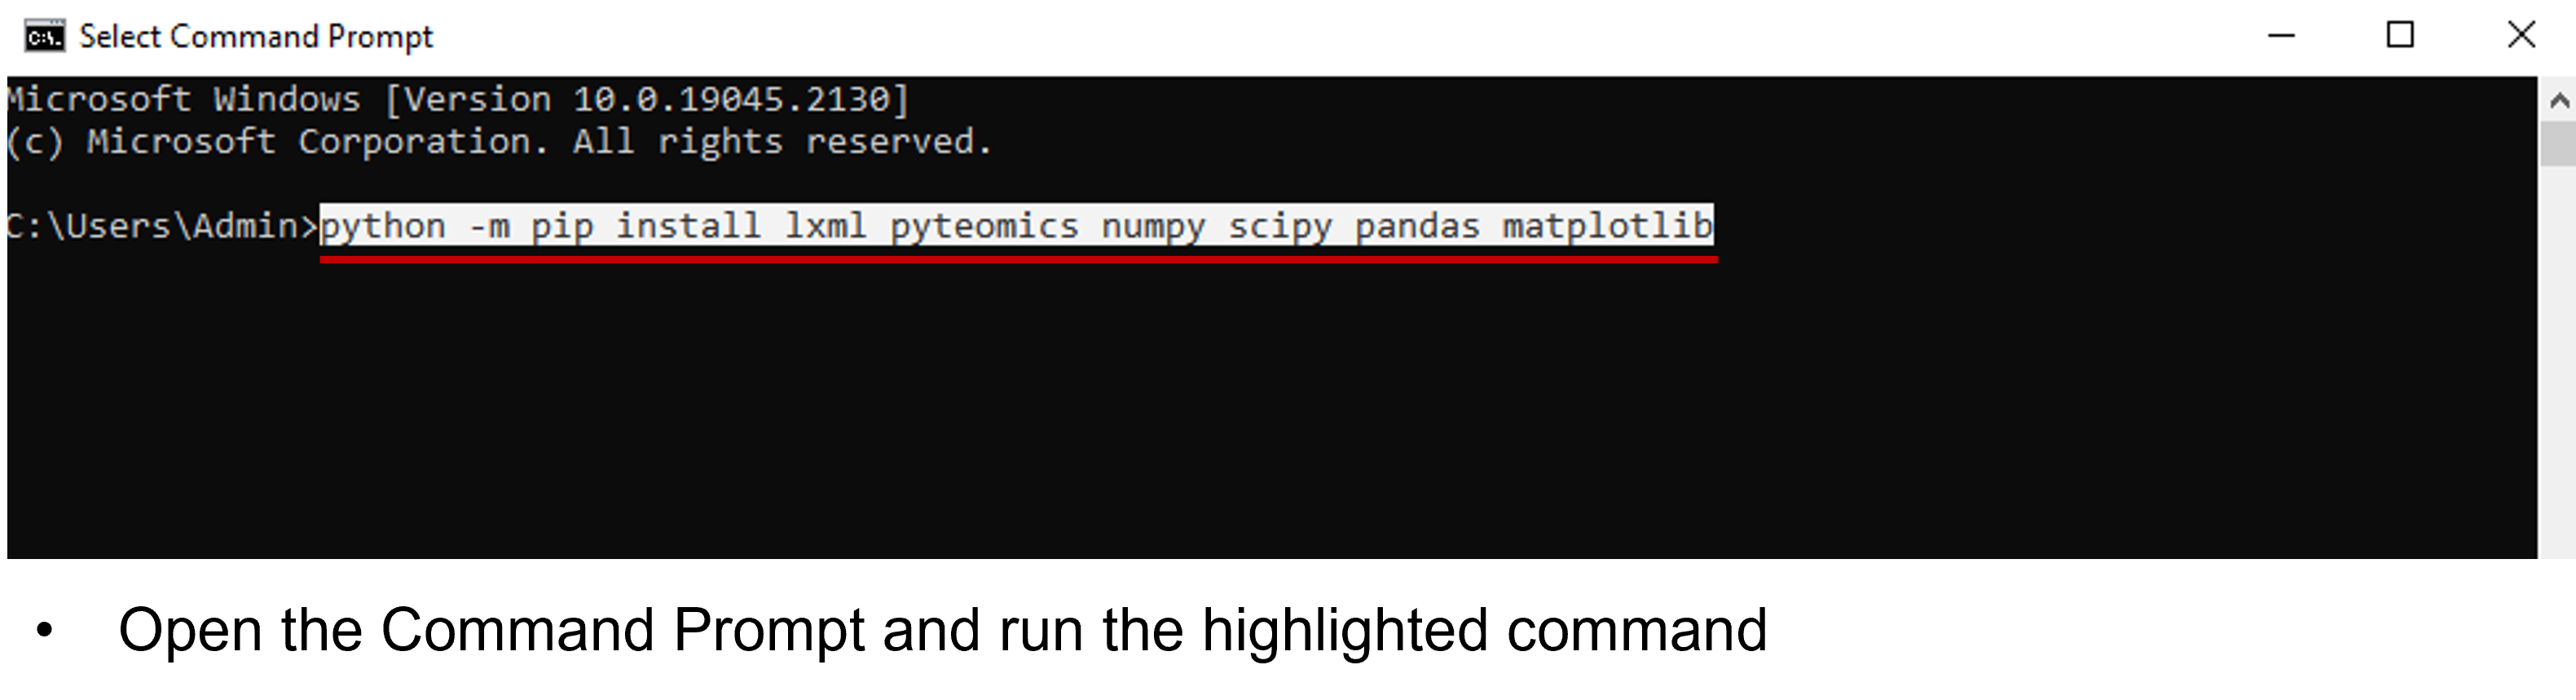
Packages are premade code usable by other software. This program depends on a number of them which can all be installed by using a single command within the command prompt (Open using windows+r, type cmd):
python -m pip install lxml pyteomics numpy scipy pandas matplotlib
note: there are no numbers, any "l" character is the letter. It is recommended to copy paste the above line directly.
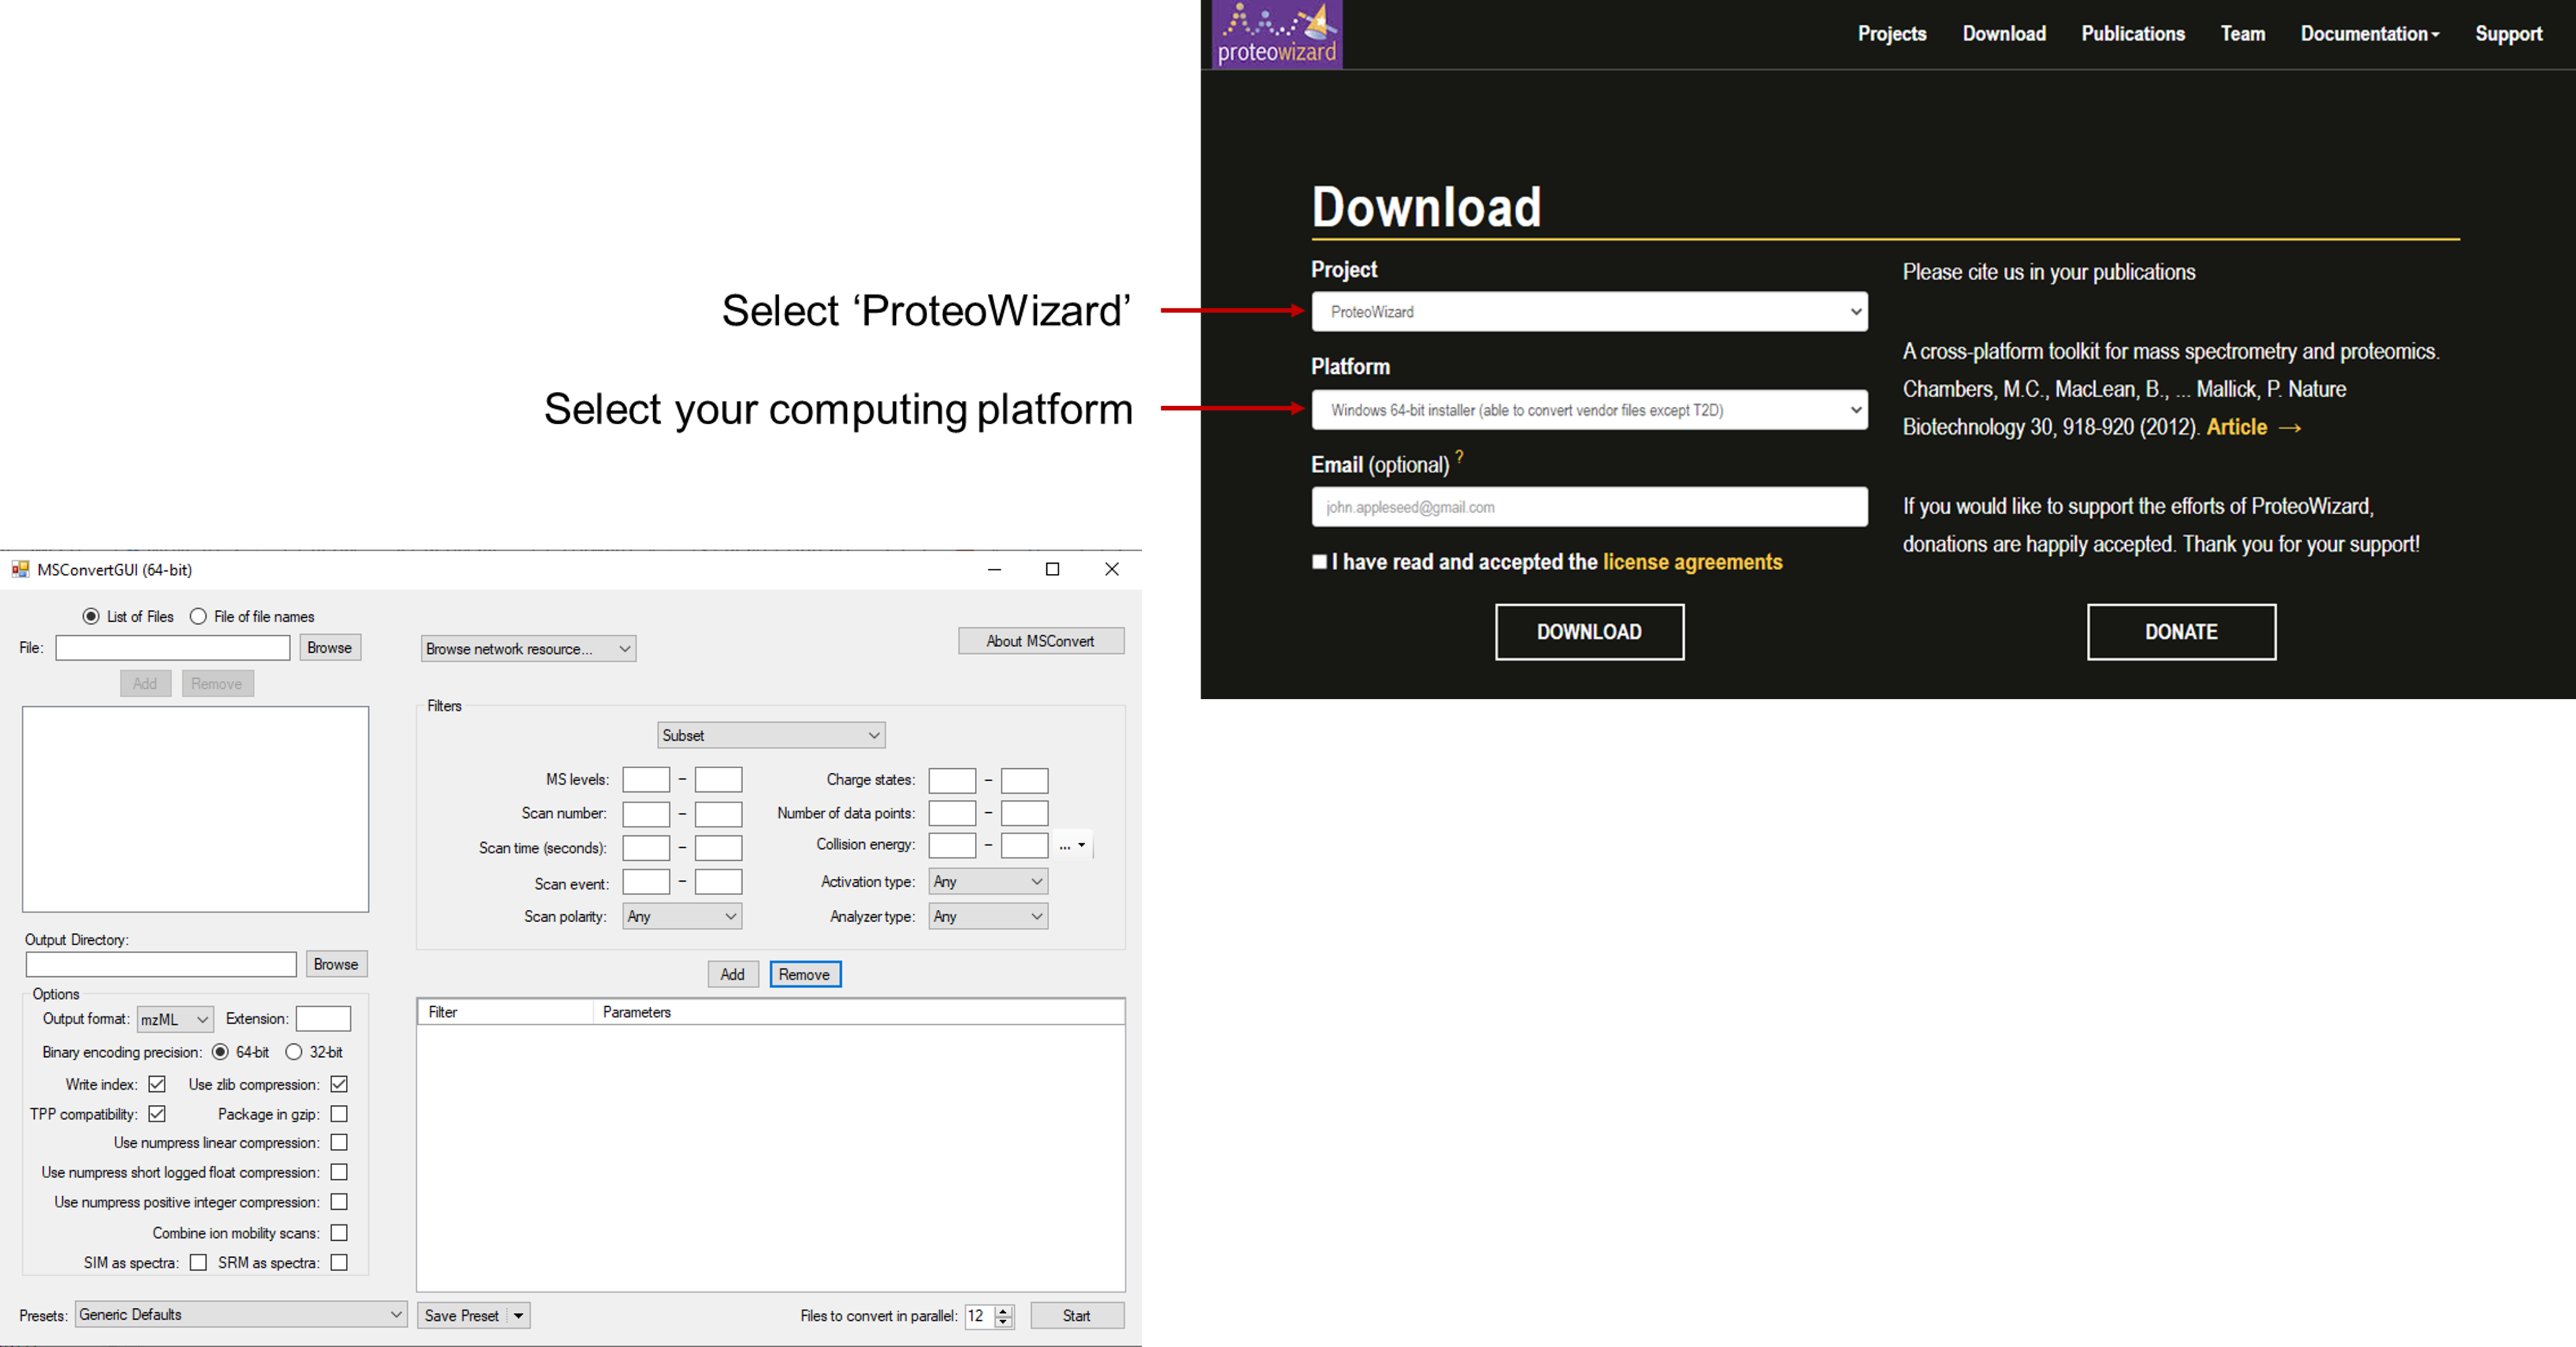
The ProteoWizard tool package contains the msConvert tool which is used to change vendor file types to mzML files. At the ProteoWizard Download Page you can download this package in order to use msConvert.
Open the file named Parameters.py or Parameters. One can use a text editor such as "Notepad" or an IDE such as PyCharm. Notepad comes installed on Windows PCs. This file is divided into four sections.
In the first you change the input files to the names of your input files (including the file extension e.g. .txt, .mzML). Leave the 'r' before the path to your input files. On Windows you can copy the path to a file by holding shift while right clicking the file then selecting "Copy as Path".

Identification mzML File- The mzML file which you performed the database search on which found the sequences you intend to search. This is not the experimental mzML(s). These will be added when the program is run.
Identification CSV File- The CSV file created from the output of your data base search. It should have the following columns (with correct name): ID, ScanNum, Precursor, Charge, Peptide An identification file is included in the zip file, however this only has the headers. The rest of the information should be populated with the results of your peptide identification software.
ID is a unique key for each sequence and is simply a column of ascending integers. ScanNum is the scan where the peptide was identified. Peptide is the sequence of amino acids. Precursor is the m/z of the identified sequence, Charge is the z integer value
Protein Sequence File This is a .txt file which simply contains the string of characters representing the amino acids in the protein being examined.
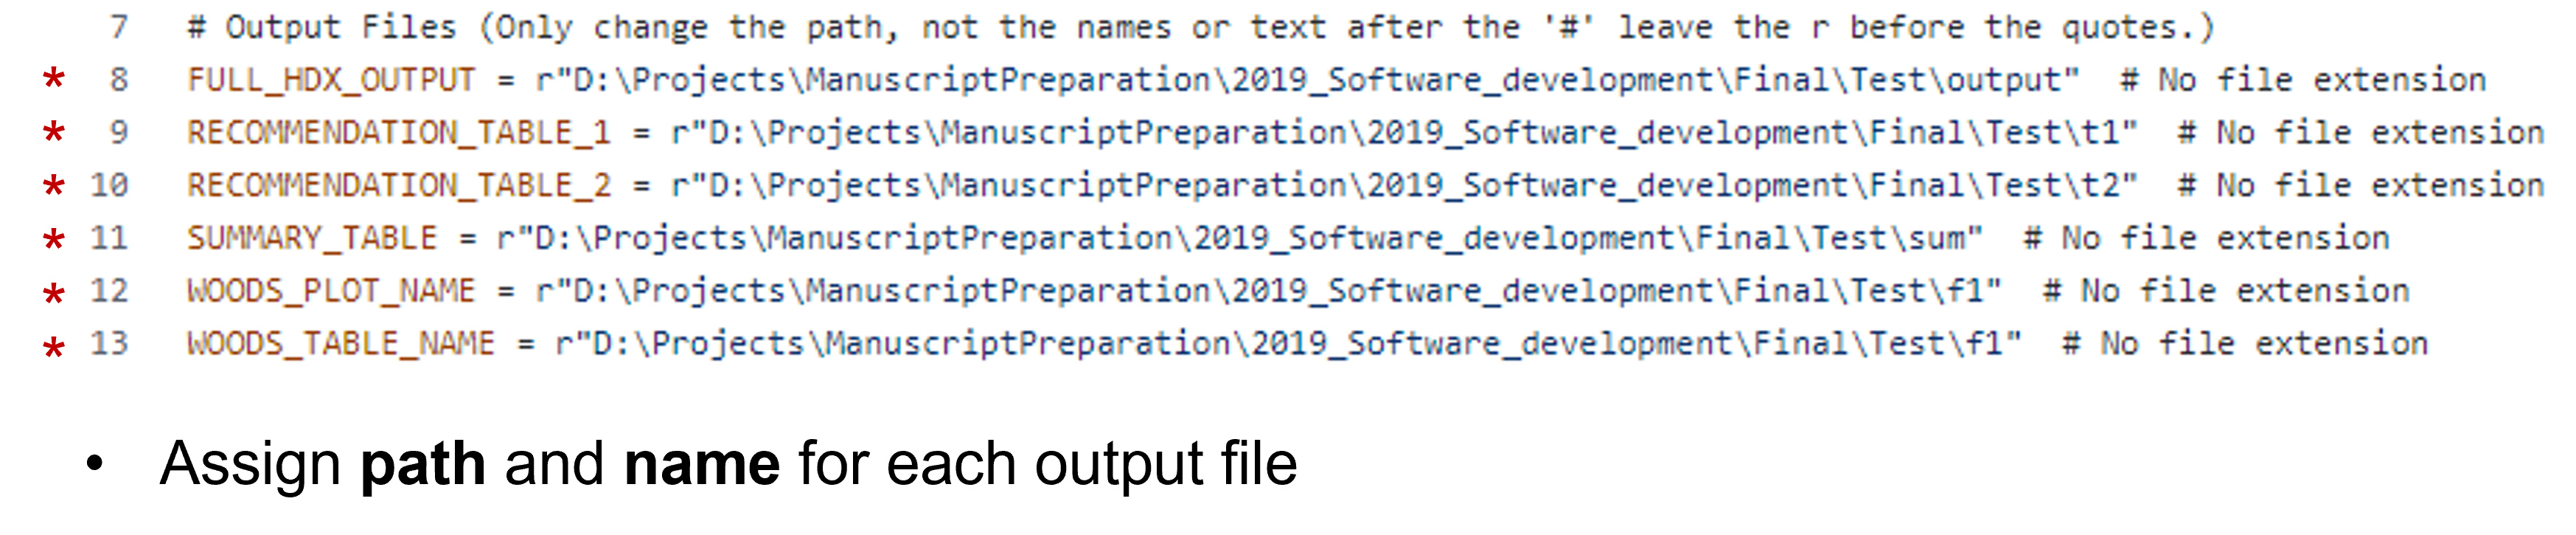
The second section is the output files. Here you can either give the path to the location of each output file or you can simply put the name of the file and it will be added to the working directory. Once again, do not remove the r before the path
In the third section are parameters you can change to tune your results. In detail these are:
- Noise Limit: This filters all individual peaks with an intensity under the PPM Match Tolerance.
- PPM Match Tolerance: Peaks with an m/z difference of less than this value are considered a match. Adjust based on the sensitivity of your Mass Spectrometer.
- Sliding Window PPM Tolerance: The sliding window will consider peaks with a PPM difference lower than this to be the same and sum their intensities.
- Sliding Window Size: This is the width of the sliding window used to merge peaks which of the same m/z and similar retention times.
- Slide Fraction: Determines the overlap of the window as it slides. A value of 1 would give no overlap. Recommended to keep below 4. Make sure Sliding Window Size is divisible by this value.
- Retention Tolerance: extends the retention time of an identification by plus and minus this value. Increase this value if there is a significant difference between the elution time of peptides in the identification run compared to the experimental run.
- Woods' Plot Confidence: Decides where to draw the confidence line on Woods' plot. A two tailed test is used in this calculation.
- Woods' Plot Title: This is the title on the absolute woods plot, not the path.
- Fractional Woods' Plot Title: Title on the fractional graph.
- Woods' Plot Height/Width: Dimension of the plot in inches.
- Deuterium Recovery Rate: Back exchange rate for experiment out of one. Used for maxD calculation
- Deuterium Fraction: Fraction of D2O to H2O used out of one.
- Condition 1 and 2: Names for the two conditions in a differential experiment. If the experiment is not differential, Condition 1 will be used.
Modify the constants with care, this can lead to incorrect evaluation.
In the command prompt navigate to the folder containing the program and associated files. This can be done by repeatedly typing "cd" followed by a space and the name of the folder. Then run the program by typing "python TheDeuteriumCalculator.py"
Example
If the program was stored at "C:\Users\User\Programs\DeuteriumCalculator\TheDeuteriumCalculator.py"
The command prompt begins in C:\Users\User
Type "cd Programs"
Type "cd DeuteriumCalculator"
In this directory
Type "python TheDeuteriumCalculator.py"
This will start the program.

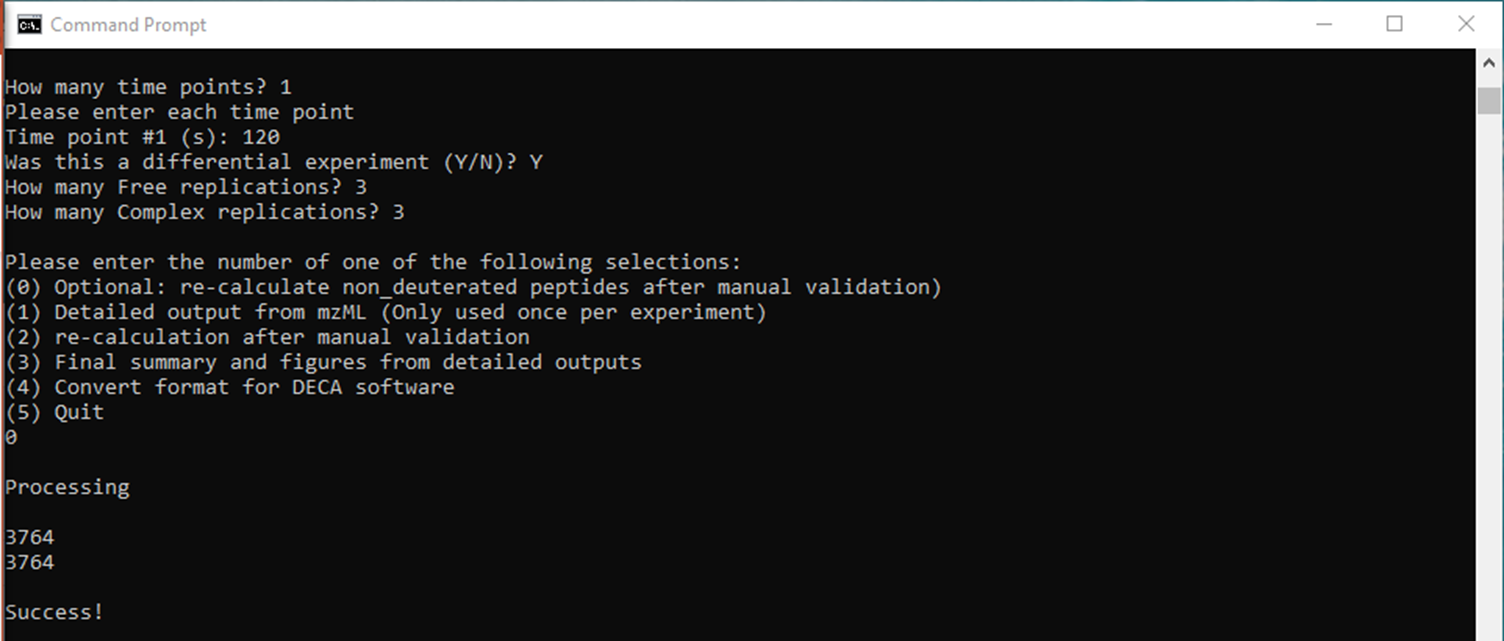
Each time the program runs you will be prompted for a number of details on the program. They are:
- The number of time points
- The time at which data were collected for each time point
- Whether the experiment was differential or not
- The number of replications (DO NOT DOUBLE FOR DIFFERENTIAL EXPERIMENTS)
This will bring you to the main menu. If this is the first time running the program for the current experiment type "1." This will begin the portion of the program which reads the data from the experimental mzML files. You will be prompted for the path to each mzML file. You can copy the path on Windows by holding shift and right clicking the file and selecting "Copy as Path." The program will then begin processing the data automatically until this step is finished. At that point detailed outputs will be generated which contain information on every peak matched.
Step two can either be selected immediately or the program may be exited allowing for manual editing of the data. This can be achieved by changing the intensity of any points that are incorrect to zero. If changes are made to the data, the program must be restarted before they can be recognized. Step two will generate the final outputs, including summary data and the Woods' Plot.


- Step one only needs to be completed once per experiment, unless user error is noticed such as incorrect selection of mzML files.
- When working on multiple experiments simultaneously the names of output files must be changed, or the files moved, or else they will be overwritten.
- Always close any existing output files before running the program.
- For every path in the Parameters.py file make sure to wrap the path in quotes and have an 'r' before the open quotes.
- Ensure that all file endings match what is requested in the Parameters.py (Some must have no file extension).
- If you get a "Memory Error" there are two options. Reduce the data complexity by making the sliding window larger, or the slide fraction smaller; or you can install the 64 bit version of python which has higher memory allowances. Windows Use the option under 3.8.1 named "Download Windows x86-64 executable installer" Make sure to check add to path again, and you must reinstall the packages using the above command.