Simple way to create signals.
The package is intended to create and develop signals of varying complexity.
The project can be used both for educational and work purposes.
It is convenient to use Jupyter Lab or
Jupyter Notebook to speed up the development
of signals, to compare their parameters with other signals,
and to visualize them.
The project is designed so that you can easily change the creation of signals.
In addition, documentation consist tutorial how to work with library and examples of ready-made signals. You can write own signal creation.
To install use:
$ pip install signal-designor using poetry
$ poetry add signal-designAlso you can clone or load project from GitHub, and install requirement packages using the
$ pip install -r requirements/build.txtor if you want develop, use
$ pip install -r requirements/dev.txt
or
$ poetry installor coping pieces of code and create your own.
The project is a library. Working with it is the same as with
other third-part libraries of the python language.
An example of how to include the library is described
here.
The library consists sub-modules:
signal_design.core- contains basic classesMathOperationandRelationProtocol.signal_design.exc- contains exceptions.signal_design.axis- contains classAxissignal_design.relation- contains classRelationsignal_design.signal- contains classSignalsignal_design.spectrum- contains classSpectrumsignal_design.default_methods- contains default methods for class above.
For convenient base classes:
Axis, Relation, Signal, Spectrum - can be imported from
the signal_design module.
For example:
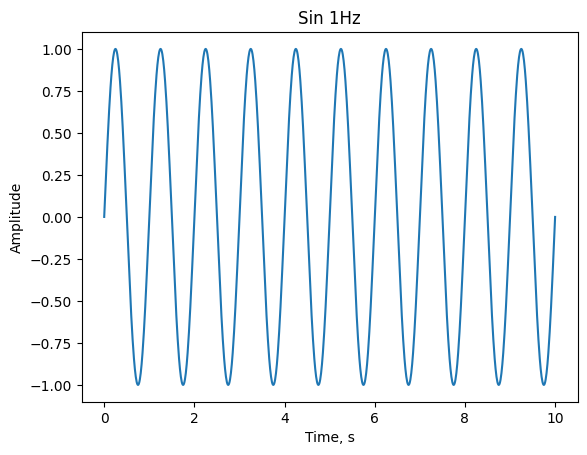
from signal_design import SignalBelow is a simple example of creating a signal and visualizing it. A more extended description of the work of the library in the documentation. Other examples are contained in the documentation contains in Tutorial section.
For the following code Matplotlib need be used
to visualize a result of work. But Matplotlib can be replaced with another
library that you use.
import numpy as np
import matplotlib.pyplot as plt

from signal_design import Axis, Signal

time = Axis.get_using_end(start=0., end=10., sample=0.01)
amplitude = np.sin(2*np.pi*time.array)
signal = Signal(time, amplitude)

plt.plot(*signal.get_data())
plt.xlabel('Time, s')
plt.ylabel('Amplitude')
plt.title('Sin 1Hz')
Result:
