SQL Trace Listeners (Payara 4.1.1.161.1)
#SQL Trace Listeners Payara Server and Micro 161 (4.1.1.161) onwards
Payara Server 161 (4.1.1.161) provides support for custom SQL Trace Listeners. A SQL Trace Listener is registered against a datasource and is called after each method call on the Payara Server connection pool. SQL Trace Listeners enable a developer to track all calls to the database and can be used to develop custom Auditing, Error handling or monitoring. SQL Trace Listeners can be enabled globally on a datasource if you class is on the server classpath or can be enabled on an application specific datasource deployed within a WAR or EAR deployment, in which case the class only needs to be on the classpath of your application i.e. contained within your WAR or EAR.
The SQL Trace Listener is implemented as shown below;
public interface SQLTraceListener {
    /**
     * Notify listeners with SQL trace information.
     * @param record SQLTraceRecord that has information related
     * to the SQL operation
     */
    public void sqlTrace(SQLTraceRecord record);

}
To write a listener you just need to implement the interface and override the sqlTrace method. The SQLTraceRecord contains information about the call to the JDBC driver. Each of the properties below has a getter on the SQLTraceRecord class;
   /**
     * Thread ID from which SQL statement originated.
     */
    private long threadID;

    /**
     * Thread Name from which SQL statement originated.
     */
    private String threadName;

    /**
     * Pool Name in which the SQL statement is executed.
     */
    private String poolName;

    /**
     * Type of SQL query. Could be PreparedStatement, CallableStatement or
     * other object types.
     */
    private String className;

    /**
     * Method that executed the query.
     */
    private String methodName;

    /**
     * Time of execution of query.
     */
    private long timeStamp;

    /**
     * Parameters of the method that executed the SQL query. Includes information
     * like SQL query, arguments and so on.
     */
private Object[] params;The Log JDBC Calls functionality of Payara Server is implemented as a SQL Trace Listener. The code of the sqltrace method is;
public class SQLTraceLogger implements SQLTraceListener {

    private static Logger _logger = initLogger();

    private static Logger initLogger() {
        _logger = LogDomains.getLogger(SQLTraceLogger.class, LogDomains.SQL_TRACE_LOGGER);
        return _logger;
    }

    public SQLTraceLogger() {

    }

    public void sqlTrace(SQLTraceRecord record) {
        _logger.log(Level.FINE, record.toString());
    }

}SQL Trace Listners can be enabled on a connection pool through the Payara Server administration console. Navigate to the advanced tab of your connection pool. Using the left hand tree view select JDBC->JDBC Connection pools->Your Connection pool. then select the Advanced Tab in the main window of the administration console. Then add the fully qualified class name of your SQL Trace Listener implementation class in the SQL Trace Listeners text field.
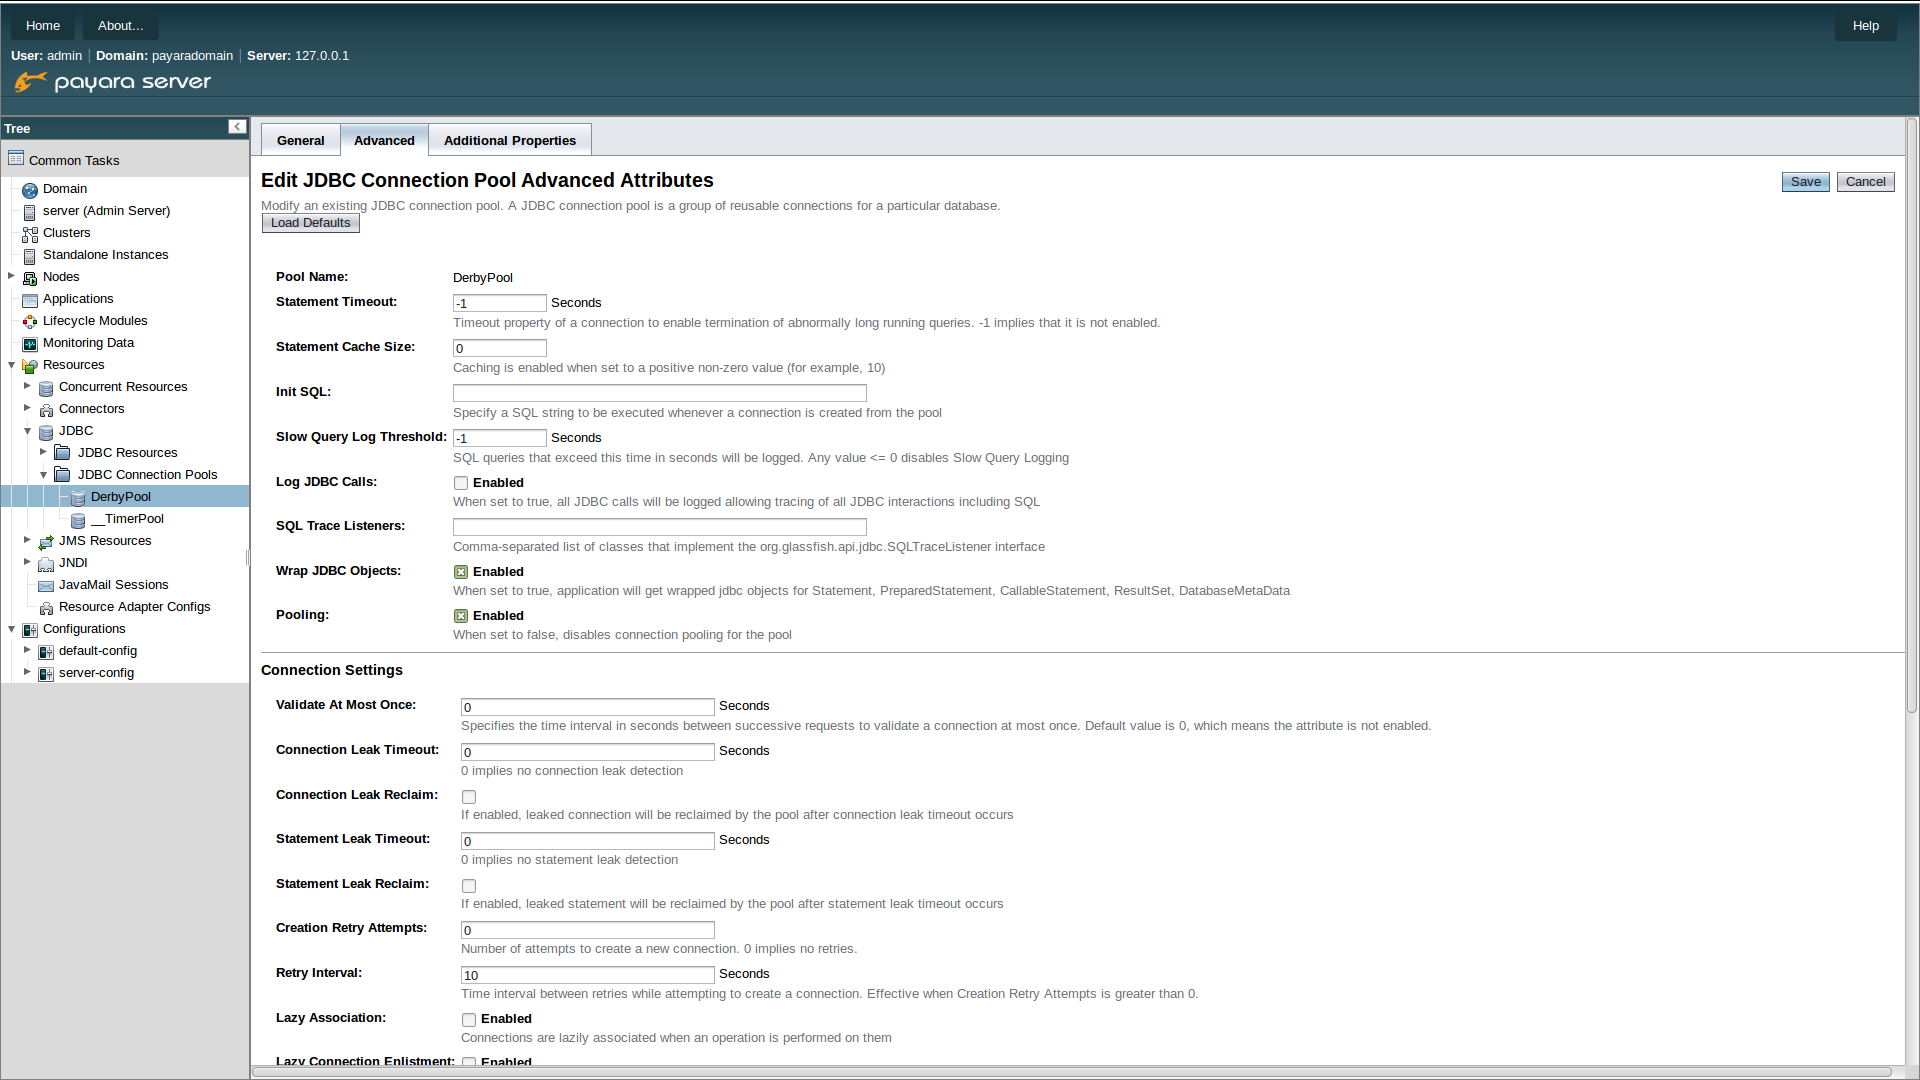 NOTE the implementation class must be on the classpath of Payara Server to be configured from the administration console.
The Adding a SQL Trace Listener to a connection pool is also possible via asadmin using the set command to set the fish.payara.lsql-trace-listeners property of your connection pool to the fully qualified classname of your listener implementation. For example the command below adds a custom listener to the __TimerPool.
asadmin set domain.resources.jdbc-connection-pool.__TimerPool.sql-trace-listeners=fish.payara.examples.payaramicro.datasource.example.CustomSQLTracerIn Java EE 7 a JDBC datasource can be deployed by adding annotations to a JavaEE component. SQL Trace Listener classes can be configured via these annotations. .
@DataSourceDefinition(
    name = "java:app/MyApp/MyDS",
    className = "org.h2.jdbcx.JdbcDataSource",
    url = "jdbc:h2:mem:test",
    properties = {"fish.payara.sql-trace-listeners=fish.payara.examples.payaramicro.datasource.example.CustomSQLTracer"})
or the Datasource definition can be added to a deployment descriptor of an application for example in the web.xml
    <data-source>
     <name>java:global/ExampleDataSource</name>
     <class-name>com.mysql.jdbc.jdbc2.optional.MysqlXADataSource</class-name>
     <server-name>localhost</server-name>
     <port-number>3306</port-number>
     <database-name>mysql</database-name>
     <user>test</user>
     <password>test</password>
     <!-- Example of how to use a Payara specific custom connection pool setting -->
     <property>
         <name>fish.payara.sql-trace-listeners</name>
         <value>fish.payara.examples.payaramicro.datasource.example.CustomSQLTracer</value>
     </property>
   </data-source>
Payara Micro also supports SQL Trace Listners which brings powerful operational diagnostics to your micro-services platform. To add a SQL Trace Listener to your datasource, deploy the datasource using the annotations or deployment descriptor described above.