You can find all the compiled projects in the Releases section.
Latest version: Release 2.1.0.1, 17/12/2022
One of the features that I loved for .net when it was introduced is the ability to create applications that does not require the user to install the .net Framework independently. I always prefer to create portable packages, something that you uncompress wherever you want and it just works. This creates a bit bigger applications but nowadays with the massive storage devices we have and the fast Internet we have this is not a problem, while having to install the framework can be painful in some cases (restricted user privileges environments, problems with old .net installations, etc).
Well, thanks to the people at Laboratoire Ouvert Grenoblois I found that the packages for unix/macos where incorrectly packaged and didn't included the framework and needed its installation... Doh!
I have re-packaged all the applications (CLI and GUI) and now all the versions include the required files, it should not need any more the installation of the .net framework.
Also, I have bumped up the firmware to the version that includes the new tail detection (beware, it will still inform that is the V1.0, I will correct the version numbering with the release of the Pico-W support).
Note: If you already have the applications and they are working ok for you that means that you already have the framework installed and there is no need to download the new packages, you only need these if you're doing a new installation or you had problems with the previous versions because the missing framework.
Have fun!
One of the goals that I want to achieve with the analyzer is to support the Pico-W. Would not be great to have a battery powered analyzer that connects to your computer via WiFi? For me at least this is a really desirable option as I have my main computer on a different desktop than the electronics bench, so when I want to analyze signals I must have a long USB cable hanging from the computer to the analyzer or I must do the analysis in the computer desktop. Also even if you are in the same desktop the less cables that you have around the easier is to work. For this, the Pico-W is ideal, as the analyzer does not transfer data in real time it does not need an extremely fast connection, for transferring the data once it has been captured the integrated WiFi of the Pico-W is more than enough.
It has been a while since I got the Pico-W and I didn't had enough time to start really digging on how the thing works, so my previous knowledge about the W was based on the first notes that were released to the Internet (I bought it at release day). Something that was stated in many places was that the W used some GPIO's to control the WiFi module so you would have less available IO's for your usage.
I have been really pleased when I have read by myself the datasheet and how the Pico has implemented in reality the WiFi module. It indeed uses some GPIO's to control the WiFi, but, those GPIO's have never been available to the user as regular GPIO's. The Pico uses GPIOs 23, 24, 25 and 29 for internal usage (LED, VBUS sense, etc). So, what have they done in the Pico-W to not to use additional GPIO's? They have lifted those functions to the GPIO's of the WiFi module. The WiFi module itself contains a GPIO port and now that port is the one that contains those functionalities, so now GPIO's 23, 24, 25 and 29 control the WiFi module and the first three GPIO's of the module are used for those functions.
So, what does all this means for the analyzer? Well, it means that very little changes needs to be done in the capture code and only the front-end code needs to be changed. Also, this means that the W version will also retain all the 24 channels, it will not lose any capability. Wohooo!!!
As all the GPIO's that are used to capture are the same there is no need to change any code except for one very small part, the "end capture" mark. The PIO always capture pins in a sequential way, it means that you cannot have "holes" in the pin sequence, and to get the full 24 channels every single available GPIO must be used, up to GPIO28. This means that the GPIOs that controlled the LED's, VBUS and so on also are captured but ignored. Said that, to mark where the capture was finished in the buffer a special value that was impossible to happen was added after the last capture, it was based on that the device those GPIOs would never be 1's. In theory, as we are capturing 32 bit words there will always be some zeroes at the tail, but I'm paranoid and also it is not elegant, so I decided to modify the tail detection code.
Instead of basing the tail detection in a mark in the buffer (which requires to iterate the buffer until it is found) now the tail detection is based in the DMA channels transfer state. This was my original idea, but unfortunatelly the Pico API does not expose a direct way of reading how many transfers have been done or how many are left, you can set them but cannot read them, so I abandoned that idea.
This time I have digged a bit more and went directly to the RP2040 datasheet and it states very clear that the TRANSFER register is R/W, so you can read how many transfers are left. I have no idea why the API does not expose it, but knowing that is very easy to access directly to the register using the dma hardware channel structure.
Now what the code does is: once the capture has finished before aborting the DMA channels it checks which one is busy (remember, there are four DMA channels in a ringed chain, so only one DMA will be busy, the one that's waiting for the next transfer from the PIO), checks how many transfers are left and based on the DMA channel number and the transfers left it computes the index of the last capture.
This is more elegant, faster and prevents that my paranoid side rings a bell each time I see that code thinking on the Pico-W, so all are advantages :D
In the repo source under the build folder you will find the UF2 file with the new detection code, so you can try it with the Pico-W, it will still use the USB to transfer the data but you can check its compatibility. I still haven't got time to try it in the W but I plan to do it soon. In any case, if you test the new firmware in a W or a regular Pico I would be thankful if you can leave a comment telling your experience, if you have found any problem or if it worked as expected.
Well, the next step will be to add the front-end code for the W, the idea is to have a single project that based on settings compile it for the W or for the regular pico. About how to implement it, I still need to check the W API for the WiFi, but one thing that I want to do for sure is to have the WiFi module off when the capture is running to avoid any kind of glitch because interferences, I fear that the traces may act as antenna and read false data, so I'm thinking that I will use UDP instead of TCP, use a broadcast address to send/receive data and as UDP does not require an stablished connection it will allow to shut down the module without breaking the network. In any case these are my first thoughts and may change once I start implementing it.
Have fun as always!
I have uploaded a new version of the PCB's and the firmware. It contains a small modification which can give great value to the device. Do you have an oscilloscope? Have you ever wanted to trigger it based on the value of a data bus? Or when some digital signals take a concrete value? Now the logic analyzer offers this functionality!
The modification is very simple, the GPIO pins used for the complex/fast triggers have been exposed through a diode and that signal can be used to trigger other devices like an oscilloscope. Or even you can chain multiple logic analyzers to have as many channels as you want! Configure your analyzer for a complex or fast trigger, connect your device to one of the EXT pins (and GND as needed) and start the capture. To chain multiple analyzers you must configure a simple trigger and connect one of the pins on the secondary analyzers to the EXT trigger pin. In the future and if it is requested I will add another capture mode for the EXT so it can chain more than 3 analyzers.
There is a small delay from the trigger to the signal, I have measured it and it is a delay of 20ns for the fast trigger (the two cycles that takes to detect and propagate the trigger condition) and 35ns for the complex one. Also, the diode introduces a small delay of 4ns, if you want to remove that delay you can skip the diode and the pull-down resistor and place a bridge where the diode should be placed, but be ware that you will leave the trigger unprotected against polarity inversions.
The external trigger has been routed to two pins, in this way you can chain as many analyzers as you want, or connect two other devices.
The new pinout is this:

Beware to not to use a new analyzer with an old shifter board, it has been also modified to include the ext signals, if you use an old sshifter with a new board you will create a short between +v5, +3.3v, GPIO0 and GPIO1 what will be fatal.
For the new shifter the pinout is the same as the analyzer but the +5v pin is the +5v/ext_ref depending on the jumper setting.
Finally I also have updated the firmware to disable the GPIO synchronizers what reduces other 4ns of delay.
Have fun!
Minor release adding the capability to abort a running capture. To use this feature you will need to update the firmware and the application.
I have updated the level shifter board. It's a minor change but it makes the shifter a lot more flexible as now you can use the internal +5V as reference for the input voltages or you can use an external voltage source as reference. Basically this allows you to use the target device's voltage sources as VRef so the board now can work with levels between 1.65v and 5.5v
New board:

To use an external VRef source you need to remove the jumper JP1 and connect the external voltage reference to the +5v/ExtVRef pins of the input header.

BEWARE!!! There is no overvoltage protection for the VRef input so you must be careful to respect the 5.5v maximum voltage limit.
- Capability to abort a running capture (under testing)
- Enclosure for the analyzer (a preview is already in the repository, do not use as I'm on the process of adjusting it)
Enjoy it!
Good news! The multiplatform application is ready!
The application has been completelly rewritten using AvaloniaUI, it works in Windows, Linux, Linux-ARM (Raspberry) and MacOSX. It has been tested under Debian, Raspbian and Windows 10, MacOSX has not been tested as I don't have a working mac but it should work without problems.
Also, the new app includes improvements over the original one, like the ability to export the captures to Sigrok and better performance in general.
Application running in Windows:

Application running in Linux:

Application running in Raspberry:

I have managed to finally test the command line application in Linux and it worked as expected so I'm releasing it.
The command line capture program is a multiplatform command line application, it has versions for Linux, MacOSX and Windows and allows to capture data directly to a CSV file. The file format is compatible with Sigrok/PulseView so you can analyze the captures with it.
NOTE FOR LINUX/MACOSX USERS: Due to how I compile the apps you will need to make the app executable with CHMOD.
The app has been tested in Linux and Windows, if any user tests it on MacOSX please leave an issue with the results, I will be very thankful :D
If at any moment you need help you can execute ./CLCapture --help and it will show you the usage help.
The app requires seven parameters to start a capture: serial port, sampling speed, channels to capture, pre-trigger samples, post-trigger samples, trigger definition and output file name.
- The first parameter is the name of the serial port of the logic analyzer.
- The second parameter is the desired capture speed in samples per second.
- The third parameter is a list of channels separated by coma, per example
1,2,3,4or1,16,24. - The fourth parameter is the number of samples to capture before the trigger.
- The fifth parameter is the number of samples to capture after the trigger.
- The sixth parameter is the trigger definition expressed in the form of: "TriggerType:(Edge, Fast or Complex),Channel:(base trigger channel),Value:(string - containing 1's and 0's indicating each trigger chanel state)". Per example, if we want an edge trigger on the positive edge using channel 4 the value would be
TriggerType:Edge,Channel:4,Value:1. If we would want a fast trigger using channels 3,4,5 and a pattern of "101" the trigger definition would beTriggerType:Fast,Channel:3,Value:101. Note that there are no spaces, each parameter is separated by coma and no quote is used. - Finally the seventh parameter is the output file name we want to generate.
A complete example to capture channels 1, 2, 3 and 4 at 100Mhz using channel 5 as positive edge trigger and storing the results in a file called "output.csv" would be similar to this:
./CLCapture /dev/ttyACM0 100000000 1,2,3,4 512 1024 TriggerType:Edge,Channel:5,Value:1 output.csv
If everything goes Ok you will see something like this:
Opening logic analyzer in port /dev/ttyACM0...
Conneced to device LOGIC_ANALYZER_V1_0 in port /dev/ttyACM0
Starting edge triggered capture...
Capture running...
The analyzer will blink while the capture is running and once it has finished it will print the result:
Capture complete, writting output file...
Done.
This capture will contain the data in CSV and is compatible with PulseView. To import it in PulseView go to "Open->Import comma-separated values...". The file is generated in a way that you don't need to change any of the CSV paramters, you will need to specify only the number of channels and the capture speed.
Once imported you will see your data, something like this:
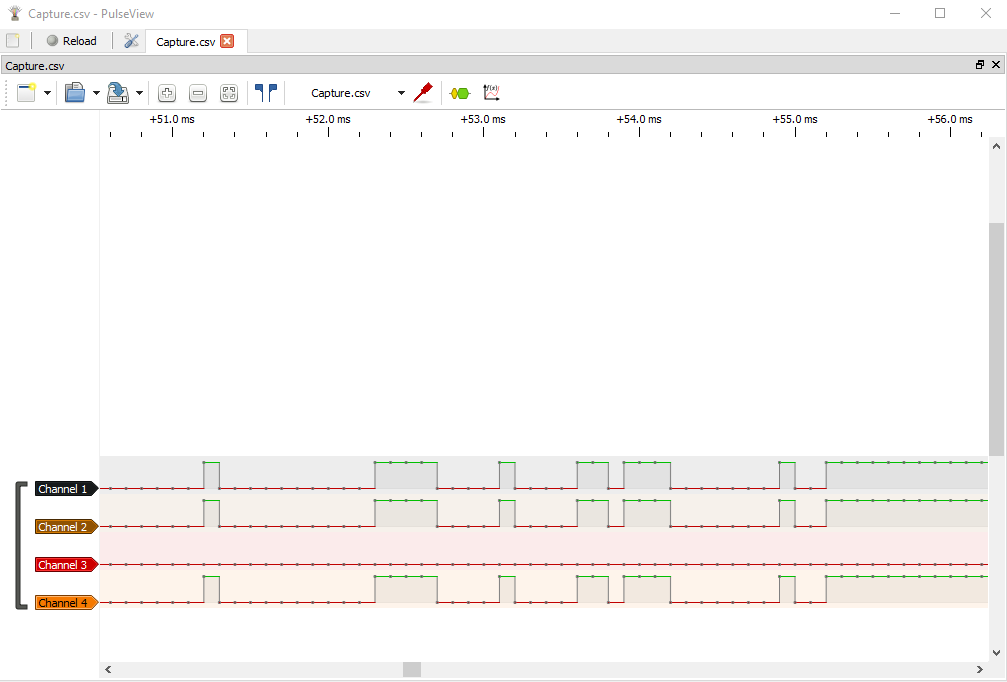
I hope that with this, at least until the multiplatform app is ready, all the users can use the analyzer the way they want, it will work in all the common OS'es and it introduces compatibility with Sigrok/Pulseview in a way that is not intrusive for Sigrok nor for the LogicAnalyzer app.
Have fun!
I have received the shifter PCB's and there is an error. The footprints of J1 and J2 are exchanged, so what should be inputs are outputs and vice-versa. Thankfully this is not a problem, as the PCB is completelly symmetric and it has components in both sides flipping the board fixes the problem.
Board before flip.

Board after flip.

The KiCad project is already updated.
The good news is that the board works like a charm, I have tested it with my clock generator with a 50Mhz clock and it captures every single half cycle perfectly, like if the board was not there :D
So if you want to build your own shifter board, it's ready and tested.
Cheap 24 channel logic analyzer with 100Msps, 32k samples deep, edge triggers and pattern triggers.
LogicAnalyzer is a very cheap analyzer based in a Raspberry Pico. The analyzer offers up to 24 digital channels, pre and post trigger sampling, edge trigger and pattern trigger up to 16 bits.
The most basic version is purely a Pico as-is, you only need to short GPIO0 and GPIO1, upload the firmware and you're good to go. Of course this has some limitations as the Pico only supports 3.3v, if you want to use it to diagnose 5v signals I also have designed a fast level shifter board.
Additionally to the hardware the logic analyzer also includes a powerful software (Windows only for now) where you can visualize the captured data, export captures, use protocol analyzers, etc.
A logic analyzer only cares about logic states of lines, so without thinking much about it you may think that any microcontroller using DMA channels that read GPIO values would be more than enough, but that is the "easy" part of a logic analyzer, the problem comes when you need to trigger the captures based in GPIO states and you want also to have data captured previously and after the trigger happens.
For that, you need to compare the read values from the GPIOs check if the pin or pins values match the requested trigger and you must do it as fast as you want to capture, so for example, the most basic comparison will at least consume 3 or 4 instructions, if each instruction is 1 to 4 cycles (more or less, I'm thinking in ARM processors) then you will use up to 16 cycles to read a sample, so you would need a 1.6Ghz CPU to sample at 100Msps.
So, how the heck the pico is able to achieve this? Well, the key are the PIO units, these units are a wonder, they are coprocessors explicitly designed to handle IO, it uses a very restricted and deterministic assembler (only nine instructions that each take a single cycle to execute) but extremely efficient, so efficient that with only two instructions is possible to create a loop that captures GPIO data up to 30 bits and redirects the program flow based in the status of one of these GPIOs.
Of course there are some limitations, that two-instruction loop can only change the execution flow based on a GPIO pin, it can't branch based on a pattern (using only two instructions) but as we have more than one unit (each pico has two units and each unit has four state machines, so you can run in parallel up to 8 programs) we can abuse a bit the system and create a separate trigger program that notifies the capture program using a pin, that's why GPIO0 and GPIO1 are shorted.
The analyzer described here has three trigger modes: edge trigger, fast pattern trigger and complex pattern trigger.
The edge trigger uses a single program, that's the basic version that uses only two instructions, runs up to 100Msps and the triggering is synchronized with the captures.
The complex triggers is the first that uses two programs, one to capture and other for the trigger. The complex trigger supports patterns up to 16 bits matched from consecutive channels in the first 16 ones. Having two programs is key to keep sampling up to 100Msps, the trigger program uses three instructions so its speed is limited to 66Msps, but the sampling can run at full speed using two instructions. Of course this presents some inconveniences, there is latency between the trigger signal and the reported trigger, also if the trigger pattern lasts less than one cycle at 66Mhz the trigger can be lost, and finally as the trigger always runs at maximum speed on lower speeds there may happen a "glitch", the trigger is raised because the pattern was found but the sampling program does not register this as it runs at a lower speed.
Finally we have the fast trigger, this uses a very clever "hack" (thanks to alastairpatrick from the Raspberry forums for the idea) that abuses the limitations of the PIO units. Each PIO unit can handle only 32 instructions, so the program counter of a state machine rolls to 0 if it's overflown, also the PIO assembler has an instruction to MOVe data from the IN pins to the program counter, and finally the PIO assembler allows to modify pin values on each instruction without using any extra cycle. So, said that, the trick consists on create a full 32 instruction program that moves the values from the GPIO to the PC and the instructions that are allocated in indexes that match the required pattern block the execution and sets a GPIO to 1. Of course this limits the possibilities for the pattern, we can use up to 5 channels for this trigger but the trigger will run at full speed (it can work even faster, up to 200Msp).
If you want more info about the triggers check the PIO code in the source as there is more explanation on how this works.
The base schematic is only the Pico with a short between GPIO0 and GPIO1 but I have designed a PCB for convenience, it has been designed to maintain trace lengths so no glitch may happen because propagation delays (at 100Mhz it should not be a problem, but in marginal cases if there is a noticeable trace length difference some picoseconds of delay can be introduced and change the analyzed values).

Also, as the Pico only supports 3.3v I have designed a level shifter board, it uses very fast transceivers (TXU0104) which met the 100Msps specifications.

ATTENTION! I'm in the process of receiving the PCBs so they are not tested, I will update this document after testing it.
There are two PCBs, one for the analyzer and other for the level shifter.


To build the firmware you need to have an environment configured for Pico development, but if you don't have it don't worry, the releases include the UF2 file, so you only need to start the Pico in program mode, drop the UF2 file to the Pico drive and that's it, you have a Logic Analyzer ready to be used.
Before designing my own analyzer I have used some cheap Chinese analyzers and all use the same software, OLS, OpenBench Logic Analyzer, and to be honest, I don't like it. So, I have implemented my own binary protocol (more info in the firmware code) and visualization software.

This is a .net desktop program for Windows (if I have enough requests I may plan to create a .net MAUI version that runs in Windows/MacOS/Linux) which allows you to visualize the capture data, highlight sampling ranges, name channels extremely fast, export the captured data preserving the capture settings and ranges, implements protocol analyzers (and a very easy system to include your own ones) and so on.

For now I have already implemented a SPI protocol analyzer but I plan to implement also I2C, RS-232 and system bus analyzers (for old computers, 16 address bits and 8 data bits). In any case, with little knowledge of C# you can add your own protocol, which makes the program capable of analyze proprietary protocols.
The capture interface is straight and self-explanatory, and the software preserves your last settings, can import settings from exported captures and allows you to re-issue a capture without having to go through the configuration process.

To build the firmware you will need a build environment for the Pico-SDK version 1.3.1 or newer. For Windows users I recommend to use the Pico-Setup project.
To build the application you will need Visual Studio 2022 with the C# language installed.
The device once connected to your PC will be detected as a serial port, no drivers are needed. Once you open the software you will have a list of serial ports and you must choose the correct one, once selected if you "Open" the device it will show the firmware version in the top section and will enable the capture buttons.
To use the analyzer connect the required channels to the signals you want to analyze, also connect at least one ground pin from the Pico to the analyzed device, press the "Capture" button, configure your settings and start the capture. The Pico will start flashing until the trigger condition is met and the capture will run.
Once the capture has finished you will see the channels, a range of up to 100 samples and the trigger event will be right at the left side of the sample area.
To name your channels you have a grey box under each one, these are textboxes where you can set whatever you want, and if you export your capture they will be preserved.
To create an highlighted region press over the numeric top bar and drag to select how many samples are highlighted.

This will open the region creation dialog where you can choose a name for your region, the color and the opacity of the highlight.


If you want to delete a region press on the numeric bar over a highlighted region and it will be deleted. Regions are also exported with captures.
To add a new protocol analyzer you need to create a .net 6.0 assembly that references the LogicAnalyzer assembly and implements at least one class based in "ProtocolAnalyzerBase". Basically you will provide a list of settings to present to the user and then you will implement an analysis function that returns analyzed channels.
Each analyzed channel will specify a list of segments where data is overlayed (to present data to the user) and also it may provide a custom renderer for the data segments. You can create your own custom renderers or just provide an instance of the already included "SimpleSegmentRenderer".
I have been reading some comments about why create my own application and why not use Sigrok as it would have been developed faster. First of all, the full project including firmware, PCB's and Windows client took me less than a week of development, I have been creating Windows apps for more than 20 years and it takes me less time to implement a rendering system, plugins and so on than implementing a third-party driver :) In any case, my main reason to not consider to use sigrok is because I tried to use it with some cheapo analyzers and on my machines it simply would not run, I'm not sure if some component that I use for development is incompatible with it but on my three machines it crashed, in one machine it does not open at all and on the other two I had random crashes when I tried to capture data.
In any case, I will try to get it running in one of my development machines and if it works I will check how complex would be to create a driver for it.
Have fun!