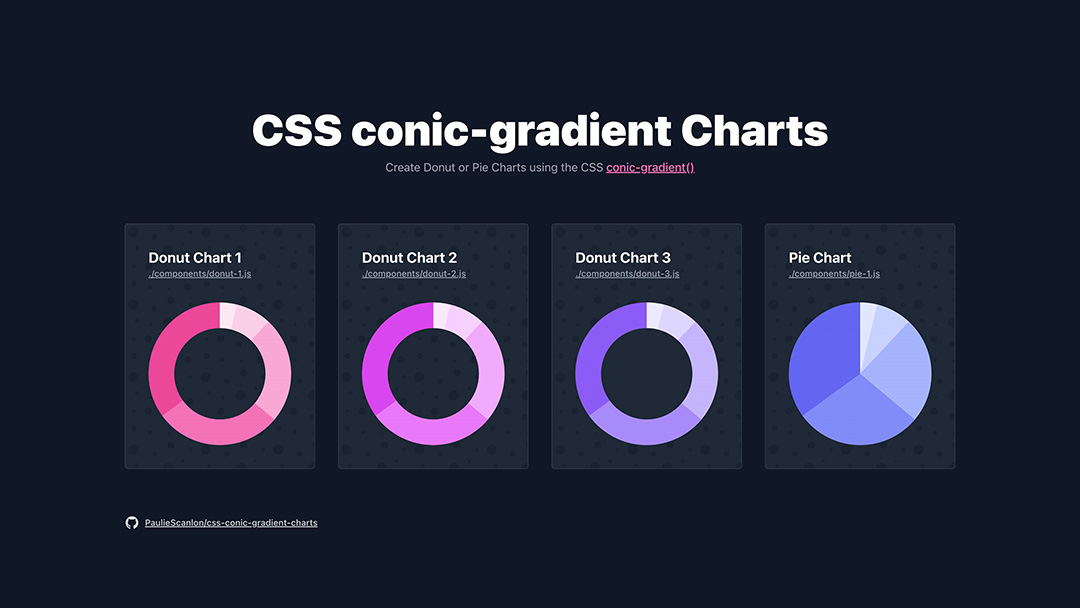
Create Donut or Pie Charts using the CSS conic-gradient
- 🚀 Live Preview: https://css-conic-gradient-charts.vercel.app/
- ✏️ Blog: https://www.smashingmagazine.com/2023/03/dynamic-donut-charts-tailwind-css-react/
Learn the principle behind this approach from Shruti Balasa. You can also see an example in the mdn web docs.
The above example by Shruti Balasa works if you know the values upfront and hardcode the color stops using E.g. pink 0deg 90deg yellow 90deg 180deg etc. However, in a lot of cases data will be dynamic and the values won't correspond to deg values that can be used to construct a conic-gradient() string.
The examples in this repo create a css_string suitable for use with conic-gradient() using dynamic data values.
const data = [
  {
    name: 'Cluster 1',
    value: 210,
  },
  {
    name: 'Cluster 2',
    value: 30,
  },
  {
    name: 'Cluster 3',
    value: 180,
  },
  {
    name: 'Cluster 4',
    value: 260,
  },
  {
    name: 'Cluster 5',
    value: 60,
  },
].sort((a, b) => a.value - b.value);

const total_value = data.reduce((a, b) => a + b.value, 0);
const convertToPercent = (num) => Math.round((num / total_value) * 100);
const convertToDegrees = (num) => Math.round((num / 100) * 360);

const css_string = data
  .reduce((items, item, index, array) => {
    items.push(item);

    item.count = item.count || 0;
    item.count += array[index - 1]?.count || item.count;
    item.start_value = array[index - 1]?.count ? array[index - 1].count : 0;
    item.end_value = item.count += item.value;
    item.start_percent = convertToPercent(item.start_value);
    item.end_percent = convertToPercent(item.end_value);
    item.start_degrees = convertToDegrees(item.start_percent);
    item.end_degrees = convertToDegrees(item.end_percent);

    return items;
  }, [])
  .map((chart, index) => {
    const { start_degrees, end_degrees } = chart;
    return ` var(--color-violet-${(index + 1) * 100}) ${start_degrees}deg ${end_degrees}deg`;
  })
.join();var(--color-violet-100) 0deg 14deg,
var(--color-violet-200) 14deg 43deg,
var(--color-violet-300) 43deg 130deg,
var(--color-violet-400) 130deg 234deg,
var(--color-violet-500) 234deg 360deg<svg viewBox='0 0 100 100' xmlns='http://www.w3.org/2000/svg' className='rounded-full'>
<foreignObject x='0' y='0' width='100' height='100'>
<div
xmlns='http://www.w3.org/1999/xhtml'
className='w-full h-full'
style={{
background: `conic-gradient(${css_string})`,
}}
/>
</foreignObject>
</svg>CSS class names are from TailwindCSS
Firefox