Phoenicis Ram Usage #1425
Comments
|
Basically you cannot really judge how much memory does it take just by looking at the process: When the OS does not need it, Java will not necesseraly release the memory even if there are free space in the heap. You need to use jmi or visualvm to see how the memory is used. Also, it seems that there are some garbadge collector that are more likely to release the memory if you want to have a smaller footprint |
|
I had a look at Phoenicis with VisualVM once. Didn't really spend too much time with it but @ImperatorS79 if you can figure out that we have unused objects etc. we can try to fix that. |
|
@ImperatorS79 for how long did you start Phoenicis? |
|
At start phoenicis seems to use 410 MB of memory. This increase if I do to the apps or engine tab and scroll down. This was tested in a VM with 1.5GB of RAM. |
|
Probably the miniatures which are created there. Don't know if it makes sense/is possible to lazy load them. |
|
Same issue here, and even after running several times java.lang.System.gc() in the console, the RAM usage is not reducing. Maybe we should investigate for memory leaks |
|
After investigation thanks to jconsole, it seems that the RAM usage of Phoenicis always go around 200Mo while the process reserves 700Mo of RAM. |
|
With -XX:+UseG1GC -XX:MaxHeapFreeRatio=30 -XX:MinHeapFreeRatio=10 -XX:-ShrinkHeapInSteps, the memory seems more stable |
|
For me, the real question is why so much memory is reserved even if it is not needed. |
|
Read this: In fact, with these options, only ~500Mb are reserved and used. So we need to optimize the memory footprint of the app anyway |
|
If you put MaxHeapFreeRatio and MinHeapFreeRatio to a small value, the memory is almost directly released. https://nvharikrishna.wordpress.com/2011/08/27/jvm-maxheapfreeratio-minheapfreeratio/ |
|
If I read it correctly, this happens if there is a lot of fluctuation. I can only imagine the repository loading to be the reason. |
|
Yes, in fact Java will trade memory to CPU usage. Because it consumes a lot of CPU cycles to release it to the OS |
|
We have to profile it (e.g. with VisualVM) to really see what's happening. |
|
Check this: I could also see that these objects are created and destroyed all the time. Without doing anything, the memory usage goes from 20MB to 500MB than back to 20MB and so on. |

|
What do they contain? |
|
I don't know. Also currently know idea where it's coming from. |
|
It should be a dependency. |
|
I'm not sure. Any idea how I can see where the Object is created? |
|
I increase the allocation trace size: Any ideas where that thread might be started? |

|
As far as I know VisualVM communicates via RMI with the JRE |
|
So this is only the debugging overhead... I can see 300MB in the sampler (JavaFX Application thread) but not from where. |
|
Another notice: If we remove bouncycastle and use a system-wide gnupg, we can save up to 40Mb of RAM |
|
@qparis how would we use |
|
System calls |
|
Is this something we want to do? |
|
I don't know what we should do. However, once thing is sure: when popping external processes, you are sure that the memory is fully released when the process is finished. |
|
This can only be the very last resort. It should be possible to figure out what's going on here. I had a look at the memory usage of the apps tab and it was not critical at all. I just don't understand why I cannot see the basic memory usage in the profiler. |
|
Tested today: 270 MB at start, 540 MB at the end. |
|
With Java 12? |
|
With Java 11. I will test with Java 12 if you wish. |
|
With : |
|
I have this when launching phoenicis: It is in my jdk from https://download.java.net/java/GA/jdk12.0.1/69cfe15208a647278a19ef0990eea691/12/GPL/openjdk-12.0.1_linux-x64_bin.tar.gz though. |
|
Yep, the jpackager you use is not the right one. I have created a script but it does not work yet on Linux |
|
Java12 only: 226-413 MB Java12 + CL: 230-434 MB |
|
CL? |
|
With the command line arguments you gave me. |
|
So worse? |
|
Well, this is not statistically significant (only 1 test) ^^. |
|
It is weird to start with 270 MB though. And I do not see how the 200 MB more could come from, I mean even 1000 .png's are not that much. |
|
If you run jvisualvmn you'll see that you have (basically)
and you add a little extra for the JVM itself. I don't have the exact calculation, we need to dig a little bit further. |
|
Well, I think dropping 100 MB would be great (and never go above 200 MB). What is strange is the increase of the ram as I am just displaying miniatures (nothing to do with JIT). |
|
Never go above 200MB is not possible. Keep in mind that we extract big archives and download big files. Other programs (like POLv4) usually spawn a subprocess to do this, so the memory is allocated but not seen in the task manager. Have you tried to have a look with visualvm? |
|
I meant for regular use (like doing nothing but looking at the available apps ^^). I am not a java developer and I have never try to look at that. |
|
like in theory you can make symlinks in /tmp that links to (swap) file for things that doesn't need the processing speed of RAM. 🤔 that's how i usually hotfix running some apps on powerless devices (raspberry Pi, etc..). EDIT: sorry that i'm trying to help then -.- |
|
What ? |
|
@ImperatorS79 I think we have clearly something with the miniature. I suspect that the wine miniatures are allocated 1000 times |
|
@ImperatorS79 For your info, with Java 12, the memory is given back to the OS much much more easily:
As you can see, the heap is quite optimized (75Mb used) However, we have to make some progress here:
|


|
Also: $ jcmd 76844 VM.native_memory
|
Is it normal than phoenicis is using 570 MB or RAM? It seems a lot for me.
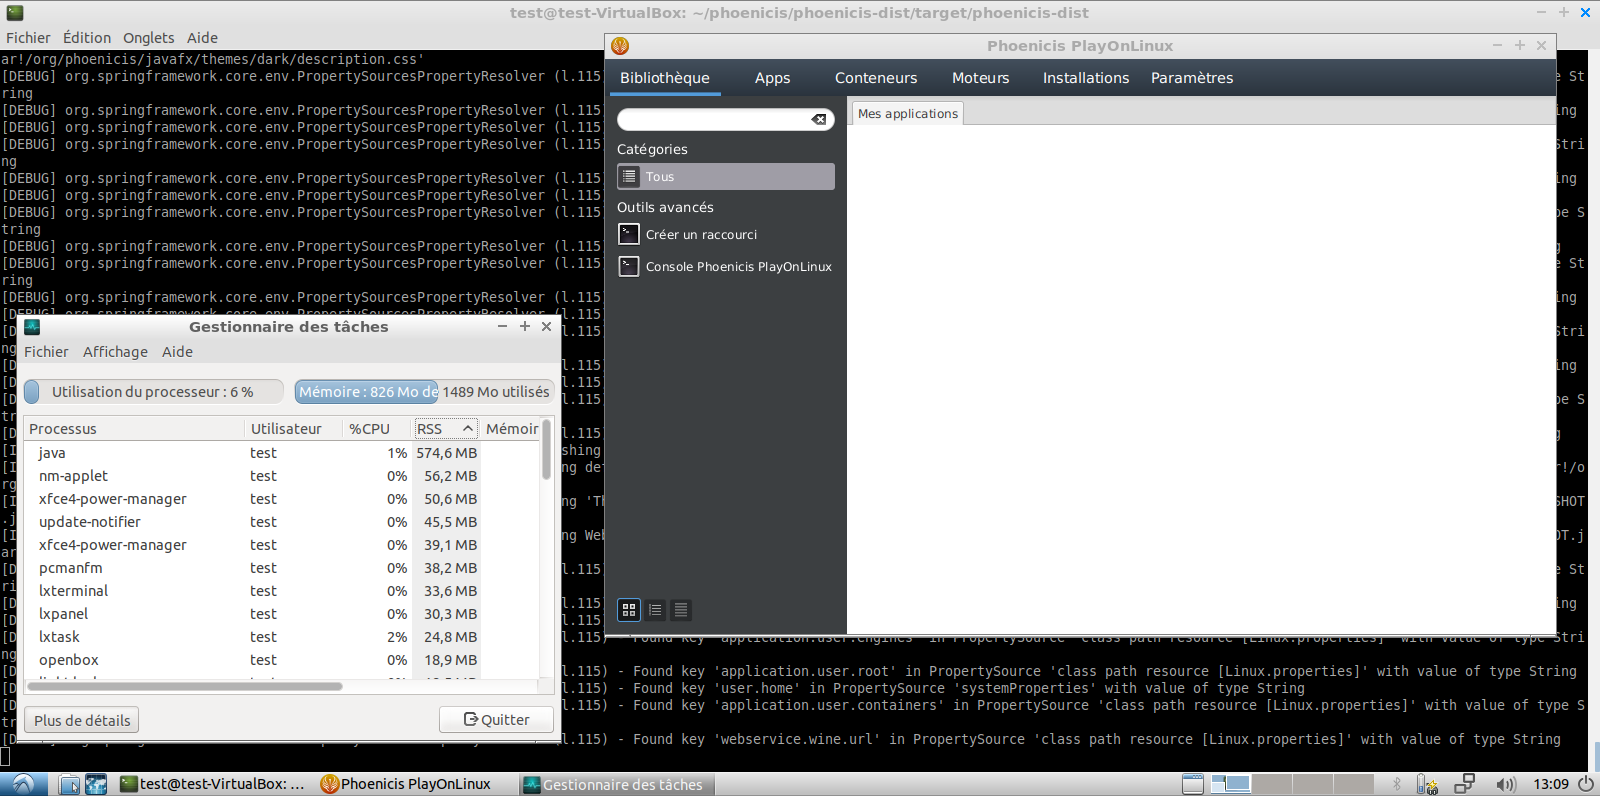
System information
The text was updated successfully, but these errors were encountered: