This free software uses open data to calculate what it would cost to
create a constant "baseload" generation profile from a combination of
wind power, solar power and storage (using batteries and the
electrolysis of hydrogen) for different European countries. Total
costs are calculated using projected assumptions for 2020, 2030 and
2050 (see assumptions.csv). Hourly weather data over 31 years are
used from the open renewables.ninja
project.
Current electricity generation costs (investment and operation) are around 50-70 EUR/MWh (not necessarily the same as the average market price).
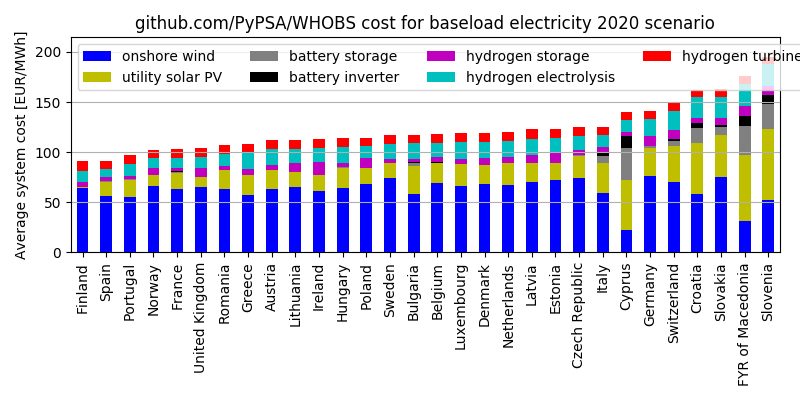
Using wind+solar+batteries+hydrogen we get total system costs (broken down by technology):
2020 assumptions (see assumptions.csv; important ones: cost of capital 5% - higher than in mature markets like Germany today - and underground hydrogen storage):
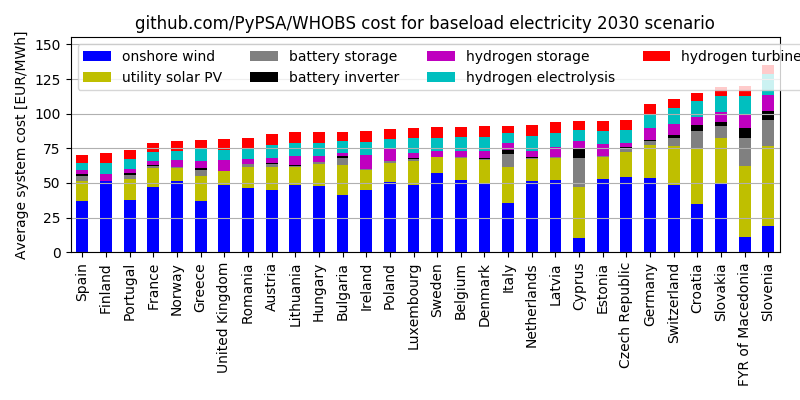
2030 assumptions (cost reductions + cost of capital to 3% as investors accustomise to renewables):
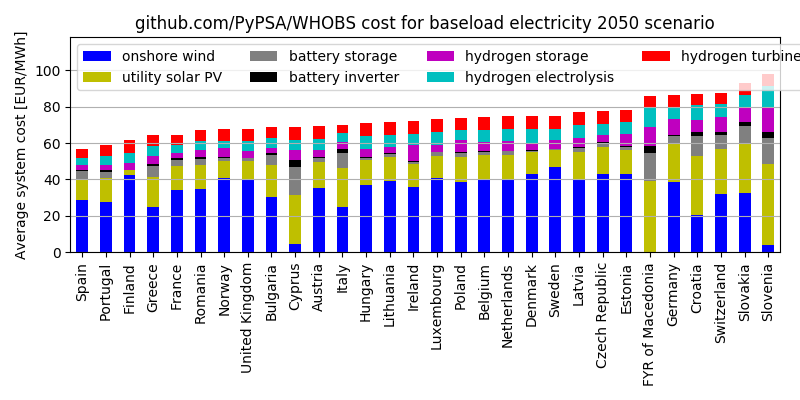
2050 assumptions (cost reductions + cost of capital to 2.5% as investors accustomise to renewables):
-
Electricity systems with zero direct CO2 emissions can be built more cheaply by using additional technology options. The examples here are simply a toy model to put an upper bound on the costs for a very simple setup. Additional generation technologies which may reduce costs include using existing hydroelectric generators, biomass from sustainable resources (such as waste and agricultural/forestry residues), offshore wind, concentrating solar thermal, geothermal, ocean energy, nuclear and fossil/biomass plants with CCS. Additional storage technologies include redox flow batteries, compressed air energy storage, etc., see this review. No import or export capacities with other countries are assumed, so each country must meet the baseload profile by itself. Existing and planned transmission grid connections between countries can reduce costs by up to 20% by smoothing wind over a larger area (see e.g. this paper or this one). Demand-side management can adapt demand to generation profiles. Furthermore, including energy demand sectors other than electricity, like transport, heating and non-electric industrial demand can offer additional flexibility (e.g. load-shifting by battery electric vehicles and electrified heating with thermal storage), see e.g. this paper.
-
Costs here are for completely decarbonised electricity systems. Reaching lower levels of decarbonisation is much cheaper and doesn't necessarily require any storage at all.
-
The wind profiles used here are converted from wind speed time series assuming the current wind turbine fleet. New and future turbines have higher capacity factors because e.g. they're taller, capturing wind energy where resources are better.
-
Because the wind and solar profiles are computed using today's distribution of power plants, there is no possibility to optimise the distribution of power plants within each country to reduce the costs of providing a baseload profile.
-
Electrolysis could be more cost effective if: waste heat from e.g. industrial sources is used to improve efficiency; the oxygen produced as a side-effect is sold.
-
Hydrogen-to-power conversion (using a combined cycle gas turbine here) may be cheaper with future cost-reductions in the production of hydrogen fuel cells.
-
The costs for underground hydrogen storage are taken from Table 3 of this NREL study, using the most expensive option ("rock caverns created by excavating comparatively impervious rock formations"). Where salt deposits exist, salt caverns would be cheaper. Studies on salt deposit availability are available for most countries, see e.g. this map for Europe.
-
The calculation here is done for a symbolic, constant 1 MW load. Scaling this up to country-level demand requires a more detailed consideration of land usage restrictions, which may affect how much onshore wind can be installed in densely-population countries. Onshore wind can be substituted with other low-carbon technologies (solar plus list above).
-
Hydrogen compression is not explicitly included, but the effect on the results is small. Underground storage is typically at 60-180 bar; PEM electrolysers output hydrogen at 60 bar or more (see e.g. this report or this one). Additional compression can reduce the volume of storage required. Compressor cost is around 100 EUR/kWH2 according to this report, which is just over 10% of the 2020 electrolyser cost (and a much smaller fraction of system costs). Going from 60 to 180 bar costs around 2 kWhH2/kg, which is around 5% of the energy content of the hydrogen, effectively reducing the efficiency of the electrolysis.
-
Costs for the electricity grid inside each country and costs for ancillary services are not included.
You'll need to install an environment for the Python programming
language (Version 3.x) along with the library
PyPSA. You can follow PyPSA's
installation
instructions or just do
pip install pypsa if you know what you're doing.
You'll also need a linear program solver, see the advice for free software solvers. To solve 31 years at once, you'll need a commercial solver like Gurobi or CPLEX.
On a standard laptop or desktop you can solve the optimisation with a couple of years of weather data, even using an open source solver like cbc (change the solver_name setting).
For the full 31 years, you'll need bigger iron, up to 20 GB RAM (the main bottleneck), and a commercial solver like Gurobi or CPLEX. It will take about 1-2 hours per country.
For the wind and solar generation time series, get from the renewables.ninja download page:
-
Solar time series
ninja_pv_europe_v1.1_sarah.csvfrom "PV v1.1 Europe" -
Wind time series
ninja_wind_europe_v1.1_current_on-offshore.csvfrom "Wind v1.1 Europe"
For short simulations, you can run the notebook run_single_simulations.ipynb.
To run them on the command line, use python whobs.py.
To run many simulations, e.g. on a cluster, use snakemake.
Results are summarised in results-181002/summary.csv. The full PyPSA
output files (including all dispatch time series) can be found on
Zenodo (6 GB).
All code in this repository is copyright 2018 Tom Brown (KIT)
This program is free software: you can redistribute it and/or modify it under the terms of the GNU General Public License as published by the Free Software Foundation; either version 3 of the License, or (at your option) any later version.
This program is distributed in the hope that it will be useful, but WITHOUT ANY WARRANTY; without even the implied warranty of MERCHANTABILITY or FITNESS FOR A PARTICULAR PURPOSE. See the GNU General Public License for more details.