Skip to content

R0tenur/visualization

Repository files navigation

GitHub All Releases Quality Gate Status codecov Lines of Code Bugs Security Rating Maintainability Rating Code Smells Reliability Rating

Schema Visualization

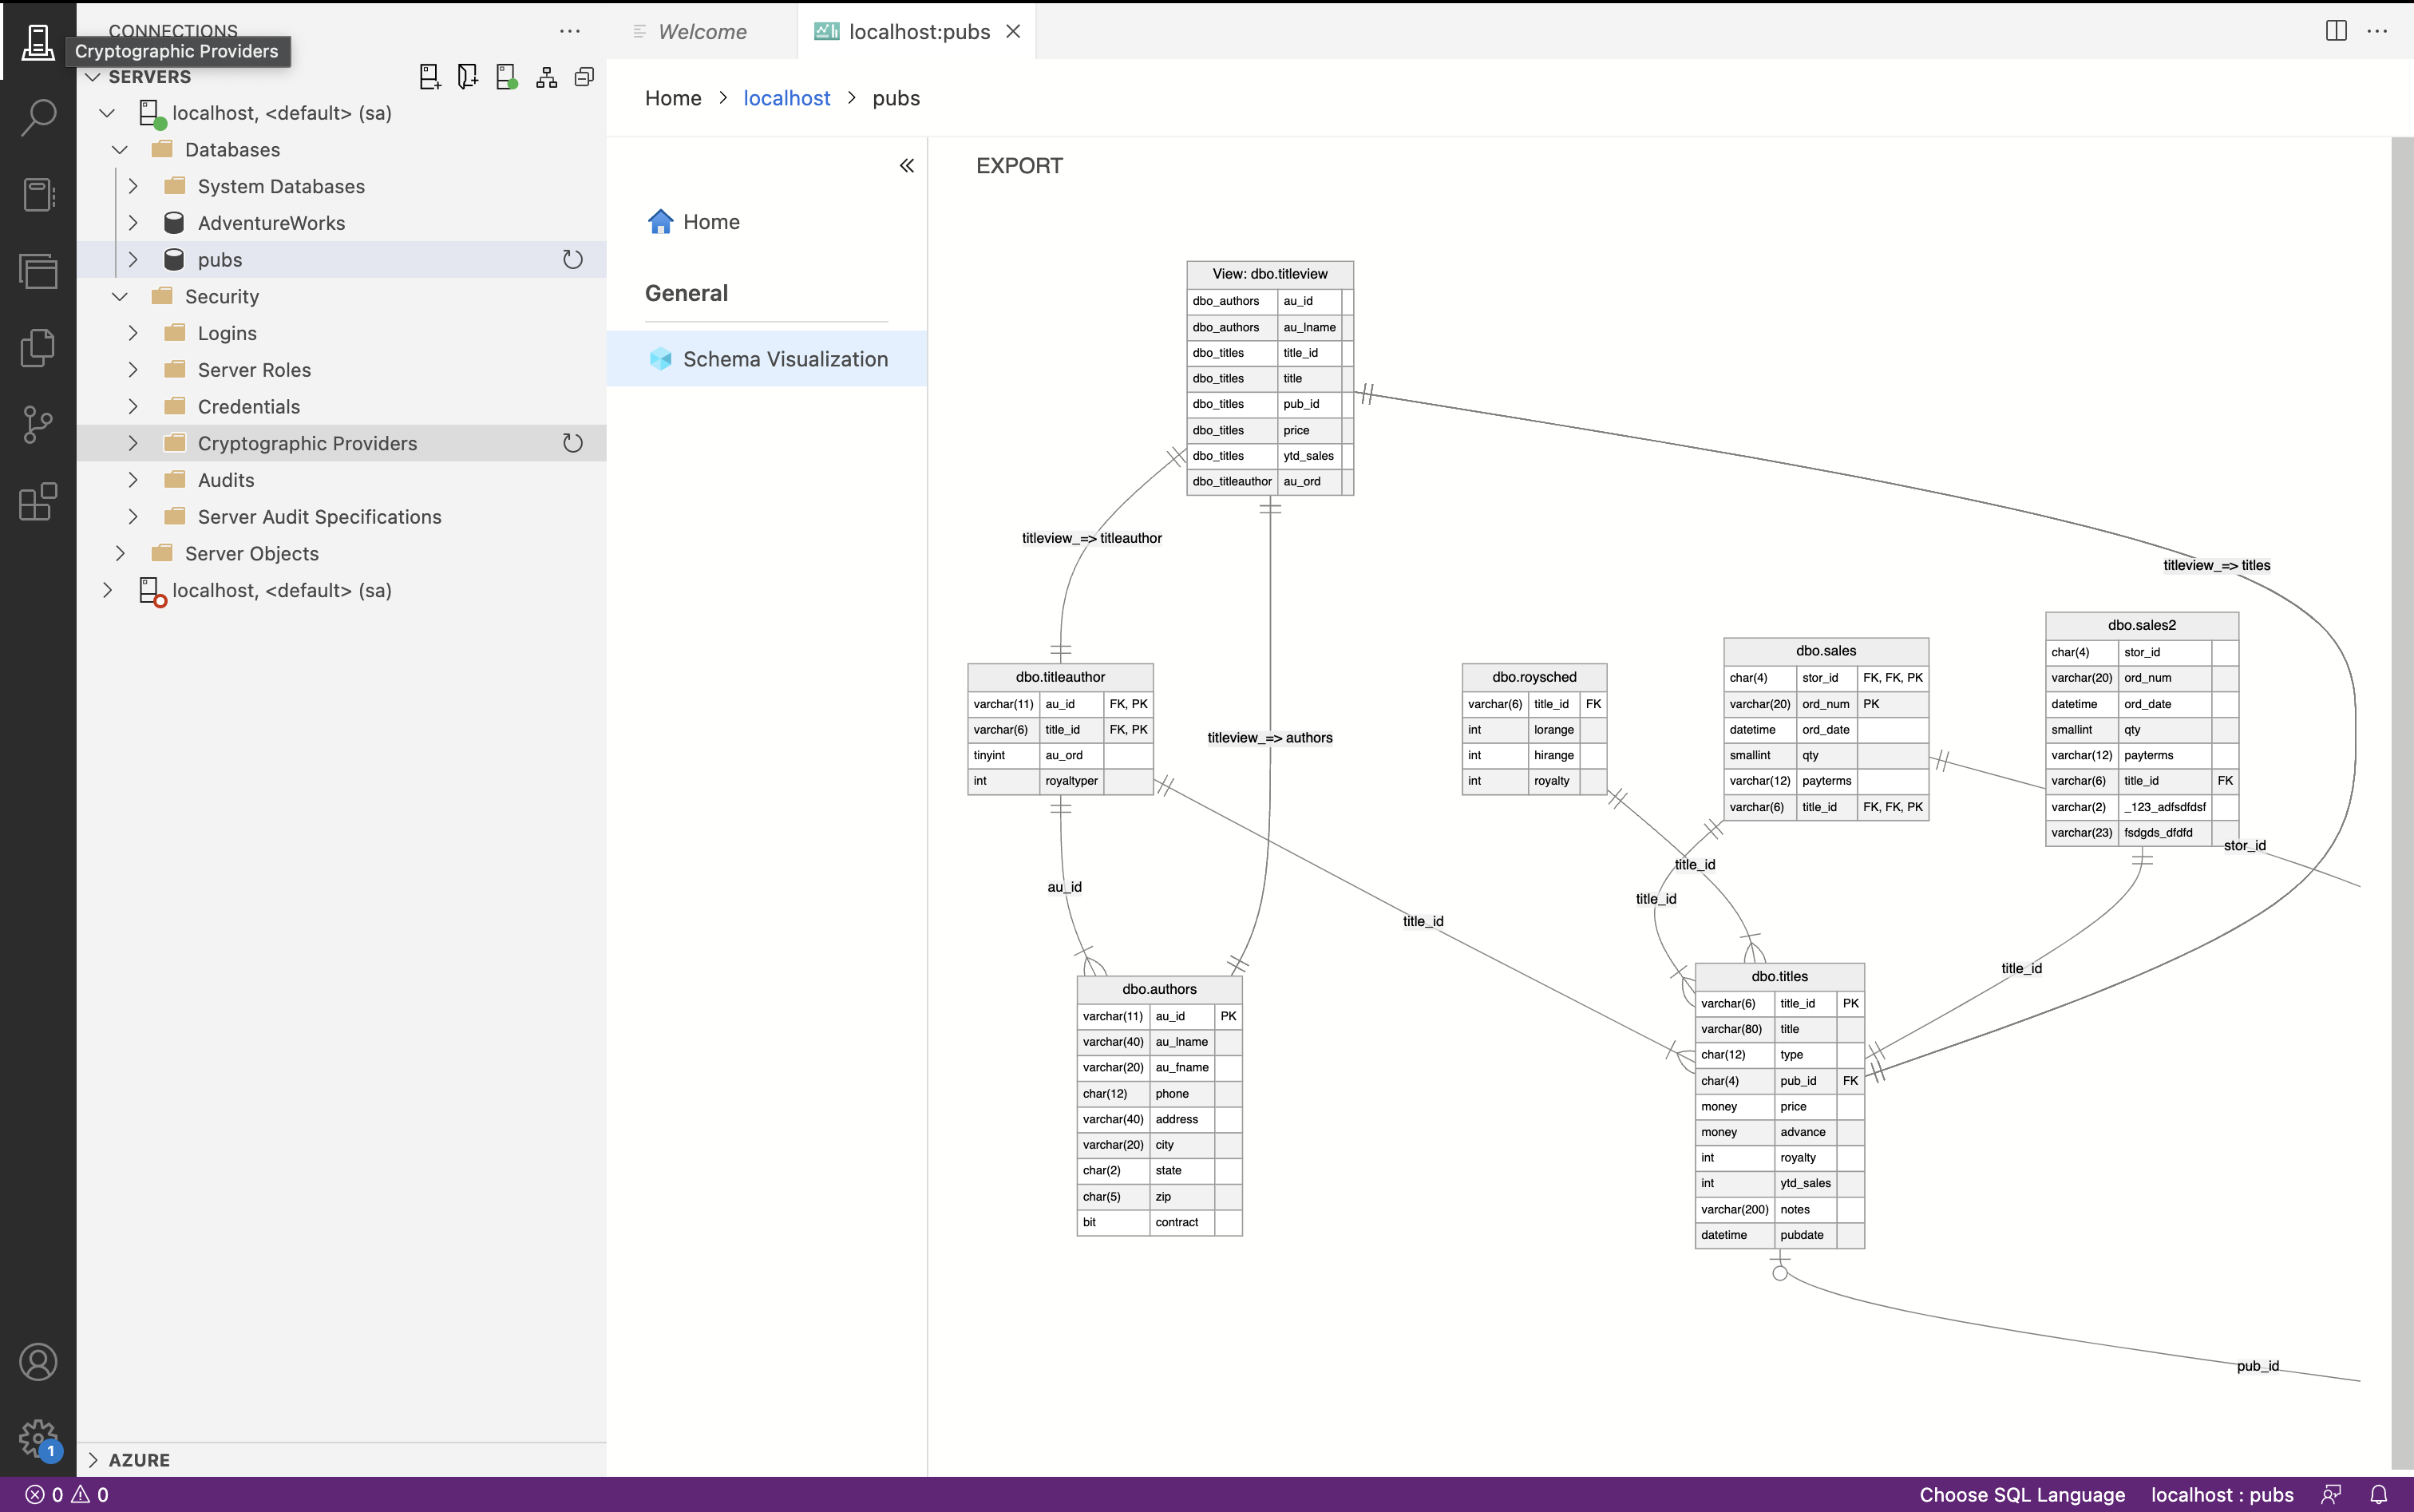
Er diagram in "Azure data studio" using mermaid.js

⚠️ This project has no serious testing: I just do some development when I think it's fun

Only MSSQL are supported

Features

  • Show database schema Double tap your db and press "Schema Visualization" on the dashboard.
  • Export the schema as svg

Example of dashboard

Installation

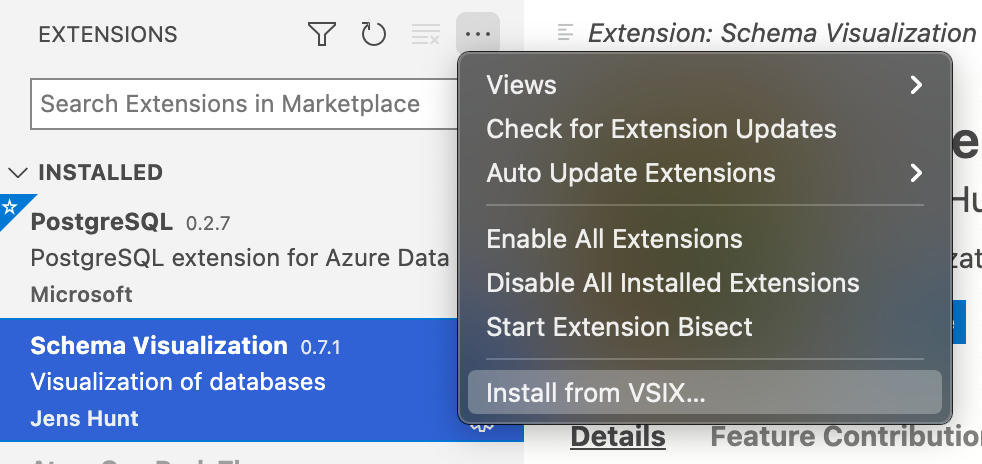
Navigate to the Releases page and download the most recent .vsix

Install it by pressing the meatball menu and select "Install from VSIX..." Installation guidelines

Found a bug or wanting additional features?

Go to the Issue page

Building and running the project locally

Go to the Docs page