Some tips, tricks and examples for using KQL for Microsoft Sentinel.
Kusto Query Language is the language used across Azure Monitor, Azure Data Explorer and Azure Log Analytics (what Microsoft Sentinel uses under the hood). I have always found this visualization regarding KQL useful -

We want to use KQL to create accurate and efficient queries to find threats, detections, patterns and anomalies from within our larger data set.
Take the below query as an example
SigninLogs
| where TimeGenerated > ago(14d)
| where UserPrincipalName == "reprise_99@testdomain.com"
| where ResultType == "0"
| where AppDisplayName == "Microsoft Teams"
| project TimeGenerated, Location, IPAddress, UserAgent
When we run a query like this the first line tells Microsoft Sentinel which table to look for data in, so in this case we want to search the SigninLogs table, which is where Azure AD sign in data is sent to. You can see a list of tables here.
Microsoft Sentinel will then run through your query sequentially, so it will run each line one by one until it hits the end, or you have an error. So to breakdown our query line by line.
SigninLogsSo first we have chosen our SigninLogs table.
SigninLogs
| where TimeGenerated > ago(14d)
Next we tell Sentinel to look back at the last 14 days worth of data in this table.
SigninLogs
| where TimeGenerated > ago(14d)
| where UserPrincipalName == "reprise_99@testdomain.com"
Next we ask Sentinel to only find logs where UserPrincipalName is equal to "reprise_99@testdomain.com"
SigninLogs
| where TimeGenerated > ago(14d)
| where UserPrincipalName == "reprise_99@testdomain.com"
| where ResultType == "0"
Then we look for only logs where the ResultType == 0, which is a successful logon to Azure AD.
SigninLogs
| where TimeGenerated > ago(14d)
| where UserPrincipalName == "reprise_99@testdomain.com"
| where ResultType == "0"
| where AppDisplayName == "Microsoft Teams"
Next we look for only signins to Microsoft Teams.
SigninLogs
| where TimeGenerated > ago(14d)
| where UserPrincipalName == "reprise_99@testdomain.com"
| where ResultType == "0"
| where AppDisplayName == "Microsoft Teams"
| project TimeGenerated, Location, IPAddress, UserAgent
Our last line uses the project operator, to return only 4 fields from our logs, so we will only see the TimeGenerated, Location, IPAddress and UserAgent returned from our SigninLogs data.
That is how you build queries, now the basics.
Microsoft Sentinel and KQL are highly optimized for time filters, so if you know the time period of data you want to search, you should filter the time range straight away. Retrieving the last 14 days of logs, then searching for a username like the below query -
SigninLogs
| where TimeGenerated > ago(14d)
| where UserPrincipalName == "reprise_99@testdomain.com"
Is much more efficient than searching first for a username and then searching for the time period like this -
SigninLogs
| where UserPrincipalName == "reprise_99@testdomain.com"
| where TimeGenerated > ago(14d)
KQL has many options for querying particular time periods.
SigninLogs
| where TimeGenerated > ago(14d)
As per the first example, this will search for the last 14 days.
SigninLogs
| where TimeGenerated > ago(14h)
You can also do hours.
SigninLogs
| where TimeGenerated > ago(14m)
And minutes.
KQL also supports querying between time ranges -
SigninLogs
| where TimeGenerated between (ago(14d) .. ago(7d))
This will find SigninLogs data between 14 days and 7 days ago.
SigninLogs
| where TimeGenerated between (ago(14h) .. ago(7h))
Between 14 hours and 7 hours ago.
SigninLogs
| where TimeGenerated between (ago(14m) .. ago(7m))
And between 14 minutes and 7 minutes ago.
Where is an operator you will use in basically every query you write. This is how you tell Microsoft Sentinel to hunt for specific data. Syntax is very important with the where operator. If we use our same example.
SigninLogs
| where TimeGenerated > ago(14d)
| where UserPrincipalName == "reprise_99@testdomain.com"
This will search our SigninLogs table, over the last 14 days, for exact matches where our UserPrincipalName equals reprise_99@testdomain.com. In KQL == is case sensitive, so if you search for reprise_99@TESTdomain.com and the username is actually reprise_99@testdomain.com, you won't get any results. The non case sensitive equivalent is =~
SigninLogs
| where TimeGenerated > ago(14d)
| where UserPrincipalName =~ "reprise_99@TESTdomain.com"
This will find any matches for reprise_99@testdomain.com regardless of case sensitivity.
Instead of equals, we can also use contains.
SigninLogs
| where TimeGenerated > ago(14d)
| where UserPrincipalName contains "reprise_99"
This will find any log entries where the UserPrincipalName contains reprise_99, if you had reprise_99@testdomain.com and reprise_99@anotherdomain.com data, it would find both. The contains operator is not case sensitive, but you can use contains_cs to make it case sensitive.
You can use either startswith or endswith if you are searching for particular patterns.
SigninLogs
| where TimeGenerated > ago(14d)
| where UserPrincipalName startswith "reprise_99"

SigninLogs
| where TimeGenerated > ago(14d)
| where UserPrincipalName endswith "testdomain.com"
Both startswith and endswith are not case sensitive, but you can use the startswith_cs or endswith_cs to make them case sensitive.
If you are searching for full words (greater than four characters), in KQL you can use the has operator. Using 'has' is more efficient than 'contains' as the data is indexed for you.
SigninLogs
| where TimeGenerated > ago(14d)
| where AppDisplayName has "Teams"
This will find any SigninLogs where the application display name has the word Teams in it, that could include "Microsoft Teams" and "Microsoft Teams Web Client", both satisfy the query.
If you are searching for multiple words you can use has_any or has_all.
SigninLogs
| where TimeGenerated > ago(14d)
| where AppDisplayName has_any ("Teams","Outlook")
This will return results where the application display name contains either "Teams" or "Outlook"
SigninLogs
| where TimeGenerated > ago(14d)
| where AppDisplayName has_all ("Teams","Outlook")
This will return results where the application display name has "Teams" and "Outlook".
If you don't know which fields to search in, you can also use wildcards, it is inefficient but may get you on the right track to find what you want.
SigninLogs
| where TimeGenerated > ago(14d)
| where * contains "reprise_99"
This will search the SigninLogs table for any field that contains reprise_99.
A number of these options also support using ! to reverse the query and find results where it is not true.
SigninLogs
| where TimeGenerated > ago(14d)
| where UserPrincipalName != "reprise_99@testdomain.com"
This query would find all SigninLogs where the UserPrincipalName does not equal reprise_99@testdomain.com
SigninLogs
| where TimeGenerated > ago(14d)
| where UserPrincipalName !contains "reprise_99"
This query would find all SigninLogs where the UserPrincipalName does not contain reprise_99
SigninLogs
| where TimeGenerated > ago(14d)
| where AppDisplayName !has "Teams"
This query would find SigninLogs where the application display name does not contain "Teams".
Project allows us to select which columns are returned in our query and in which order.
SigninLogs
| where TimeGenerated > ago(14d)
| where UserPrincipalName == "reprise_99@testdomain.com"
| where ResultType == "0"
| where AppDisplayName == "Microsoft Teams"
| project TimeGenerated, Location, IPAddress, UserAgent
This query searches for SigninLogs data from the last 14 days, where the UserPrincipalname equals reprise_99@testdomain.com, where the ResultType is 0, where the application display name equals "Microsoft Teams", then for each match on that query it returns the TimeGenerated, Location, IPAddress and the UserAgent.
We can rename colums as part of the same function.
| project LogTime=TimeGenerated, SigninLocation=Location, IP=IPAddress, Agent=UserAgentThis returns the same data, but renames the columns to LogTime, SigninLocation, IP and Agent.
We can even manipulate the output inline with the project operator.
| project LocalTime=TimeGenerated+5h, Location, IPAddress, UserAgentThis returns the same data, but changes the TimeGenerated name to LocalTime and converts to a +5h time zone if you work in that time zone.
project-away is the opposite of project and will remove columns from your query.
SigninLogs
| where TimeGenerated > ago(14d)
| project-away UserAgent
| where UserPrincipalName == "reprise_99@testdomain.com"
| where ResultType == "0"
| where AppDisplayName == "Microsoft Teams"
In this query we remove UserAgent. Remember, if you remove a column you then can't access it later in your query.
Summarize produces a table that aggregates the content of your query. Summarize has a number of underlying aggregation functions. If we again take our example query, we can manipulate the results in various ways using summarize.
SigninLogs
| where TimeGenerated > ago(14d)
| where UserPrincipalName == "reprise_99@testdomain.com"
| where ResultType == "0"
| summarize count() by AppDisplayName
This query will look up the SigninLogs table for any events in the last 14 days, for any matches for reprise_99@testdomain.com, where the result is a success (ResultType == 0) and then summarize those events by the application display name.
You can optionally name the result column.
SigninLogs
| where TimeGenerated > ago(14d)
| where UserPrincipalName == "reprise_99@testdomain.com"
| where ResultType == "0"
| summarize AppCount=count() by AppDisplayName
This returns the same data but updates the name of the returned column to AppCount.
Instead of a total count, you can summarize a distinct count.
SigninLogs
| where TimeGenerated > ago(14d)
| where UserPrincipalName == "reprise_99@testdomain.com"
| where ResultType == "0"
| summarize DistinctAppCount=dcount(AppDisplayName) by AppDisplayName
This will return a single record for each distinct application reprise_99@testdomain.com signed into.
You can use the arg_max and arg_min functions to return either the newest or oldest record that matches your query.
SigninLogs
| where TimeGenerated > ago(14d)
| where UserPrincipalName == "reprise_99@testdomain.com"
| where ResultType == "0"
| summarize arg_max(TimeGenerated, *) by UserPrincipalName
This query looks for all signin logs over the last 14 days, that have reprise_99@testdomain.com as the UserPrincipalname, that are successful and then returns the latest record.
SigninLogs
| where TimeGenerated > ago(14d)
| where UserPrincipalName == "reprise_99@testdomain.com"
| where ResultType == "0"
| summarize arg_min(TimeGenerated, *) by UserPrincipalName
This is the same but returns the oldest record.
You can use countif to provide logic to your summations.
SigninLogs
| where TimeGenerated > ago(14d)
| where UserPrincipalName == "reprise_99@testdomain.com"
| where ResultType == "0"
| summarize TeamsLogons=countif(AppDisplayName has "Teams"), SharePointLogons=countif(AppDisplayName has "SharePoint")
This summarizes the data into two new columns, TeamsLogons where the application display name has "Teams" and SharePointLogons where the application display name has "SharePoint"
You can further manipulate your data by telling KQL to place your data into time 'bins'.
SigninLogs
| where TimeGenerated > ago(14d)
| where UserPrincipalName == "reprise_99@testdomain.com"
| where ResultType == "0"
| summarize AppCount=count() by AppDisplayName, bin(TimeGenerated, 1d)
This returns the same data as our first summarize example and then groups that data into 1d bins.
You can combine these functions together where useful
SigninLogs
| where TimeGenerated > ago(14d)
| where UserPrincipalName == "reprise_99@testdomain.com"
| where ResultType == "0"
| summarize TeamsLogons=countif(AppDisplayName has "Teams"), SharePointLogons=countif(AppDisplayName has "SharePoint") by bin(TimeGenerated, 1d)
This is a combination of our countif and bin functions, where we summarize based on our application display name and also place the results into 1d bins.
You can make a set of items within a query.
SigninLogs
| where TimeGenerated > ago(14d)
| where UserPrincipalName == "reprise_99@testdomain.com"
| where ResultType == "0"
| summarize AppList=make_set(AppDisplayName) by UserPrincipalName
This will output a list of applications that reprise_99@testdomain.com has signed into to a list called AppList.
You can combine this with our time bin.
SigninLogs
| where TimeGenerated > ago(14d)
| where UserPrincipalName == "reprise_99@testdomain.com"
| where ResultType == "0"
| summarize AppList=make_set(AppDisplayName) by UserPrincipalName, bin(TimeGenerated, 1d)
This will make a list of applications that reprise_99@testdomain.com has signed into separated into one list per day.
The render operator allows KQL to visualize data into different formats such as piecharts, time or areacharts and column and bar charts.
If we use our same example from our Signinlogs table, we can see how we can visualize the data in various ways.
SigninLogs
| where TimeGenerated > ago(14d)
| where UserPrincipalName == "reprise_99@testdomain.com"
| where ResultType == "0"
| summarize AppCount=count()by AppDisplayName
| render piechart
This query summarizes all the applications reprise_99@testdomain.com has signed into in the last 14 days, then renders the output as a piechart.

You can also render as a column chart.
SigninLogs
| where TimeGenerated > ago(14d)
| where UserPrincipalName == "reprise_99@testdomain.com"
| where ResultType == "0"
| summarize AppCount=count()by AppDisplayName
| render columnchart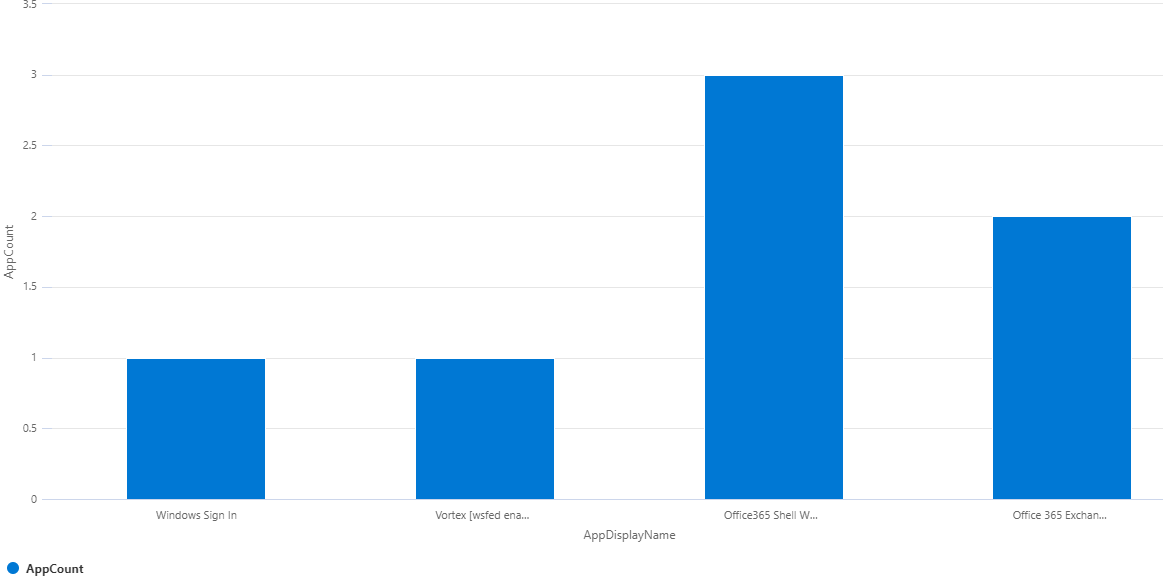
Or a barchart.
SigninLogs
| where TimeGenerated > ago(14d)
| where UserPrincipalName == "reprise_99@testdomain.com"
| where ResultType == "0"
| summarize AppCount=count()by AppDisplayName
| render barchart
For time data, you first summarize your data into time 'bins' as outlined in the summarize section, and you can then visualize your data over a time period.
SigninLogs
| where TimeGenerated > ago(14d)
| where UserPrincipalName == "reprise_99@testdomain.com"
| where ResultType == "0"
| summarize SigninCount=count() by bin(TimeGenerated, 1d)
| render timechart
This visualizes all signins by reprise_99@testdomain.com per day over the last 14 days and displays it as a timechart.

You can also use render as an areachart.
SigninLogs
| where TimeGenerated > ago(14d)
| where UserPrincipalName == "reprise_99@testdomain.com"
| where ResultType == "0"
| summarize SigninCount=count() by bin(TimeGenerated, 1d)
| render areachart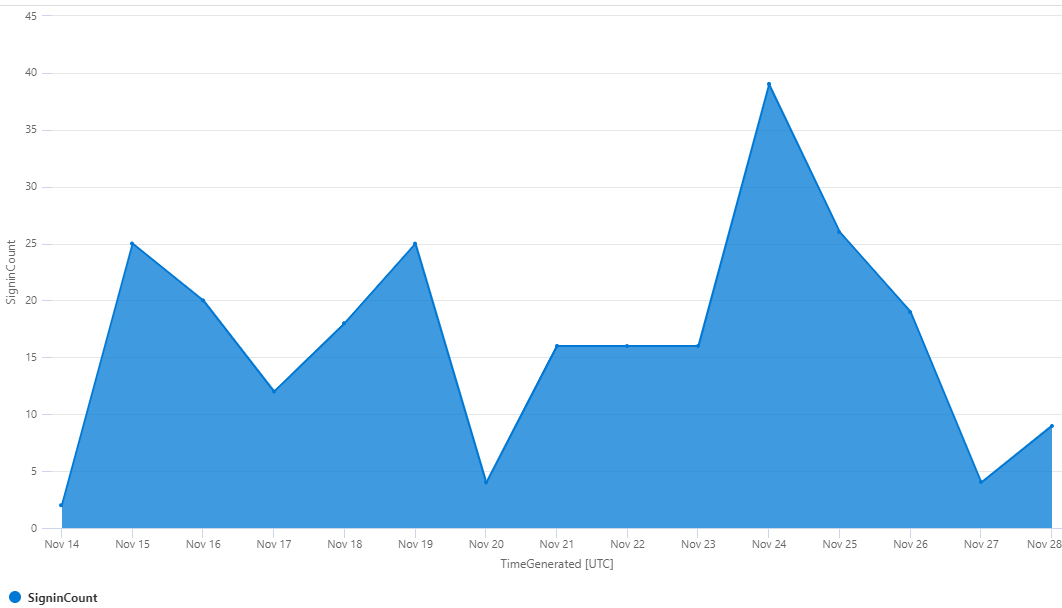
Column charts and bar charts can also be used with time data. You will get a column or bar per time 'bin' over your larger time period.
SigninLogs
| where TimeGenerated > ago(14d)
| where UserPrincipalName == "reprise_99@testdomain.com"
| where ResultType == "0"
| summarize SigninCount=count() by bin(TimeGenerated, 1d)
| render columnchart
This is the same query as our timechart, but rendered as a column chart with a column per day.

SigninLogs
| where TimeGenerated > ago(14d)
| where UserPrincipalName == "reprise_99@testdomain.com"
| where ResultType == "0"
| summarize SigninCount=count() by bin(TimeGenerated, 1d)
| render barchart
And a bar chart.

With column or bar charts you can have them stacked together (which is the default).
SigninLogs
| where TimeGenerated > ago(14d)
| where UserPrincipalName == "reprise_99@testdomain.com"
| where ResultType == "0"
| summarize SigninCount=count() by AppDisplayName, bin(TimeGenerated, 1d)
| render columnchart
This query finds all the signins for our account, counts the signins per application, then creates a single column for each day.

If you want each application to have its own column you can set it to be unstacked.
SigninLogs
| where TimeGenerated > ago(14d)
| where UserPrincipalName == "reprise_99@testdomain.com"
| where ResultType == "0"
| summarize SigninCount=count() by bin(TimeGenerated, 1d)
| render columnchart with (kind=unstacked)
You can also rename the axis and title of your chart in line with KQL.
SigninLogs
| where TimeGenerated > ago(14d)
| where UserPrincipalName == "reprise_99@testdomain.com"
| where ResultType == "0"
| summarize SigninCount=count() by AppDisplayName, bin(TimeGenerated, 1d)
| render columnchart with (kind=unstacked, ytitle="Total Sign Ins", xtitle="Day", title="Application Signins Per Day")
You can combine logic in your summarize actions to build dynamic content for your render operator.
SigninLogs
| where TimeGenerated > ago(14d)
| where ResultType == "0"
| summarize TeamsCount=countif(AppDisplayName has "Teams"), OneDrive=countif(AppDisplayName has "OneDrive"), SharePointCount=countif(AppDisplayName has "SharePoint") by bin(TimeGenerated, 1d)
| render columnchart with (kind=unstacked, ytitle="Sign In Count", xtitle="Day", title="Teams vs OneDrive vs SharePoint Sign Ins Per Day")
This query searches all signins to your tenant, then counts three groups - one where the application display name has "Teams", one where the application display name has "OneDrive" and one where the application display name has "SharePoint" for each day over the last 14 days, then renders as an unstacked column chart.

Parse and split are two different ways to extend a string of data to multiple columns based on matches. A lot of logs ingested to Microsoft Sentinel may come in as a single long string (such as sysmon), parse and split allow you to manipulate them into readable data.
For these examples, we will use the following test data
let ExampleText = datatable(TestData:string)
[
'Name=Reprise99,UPNSuffix=testdomain.com,AadTenantId=345c1234-a833-43e4-1d34-123440a5bcdd1,AadUserId=cf6f2df6-b754-48dc-b7bc-c8339caf211,DisplayName=Test User,Type=account'
];
This data is just a single string that looks like this.

We can parse out particular data matches with the following
let ExampleText = datatable(TestData:string)
[
'Name=Reprise99,UPNSuffix=testdomain.com,AadTenantId=345c1234-a833-43e4-1d34-123440a5bcdd1,AadUserId=cf6f2df6-b754-48dc-b7bc-c8339caf211,DisplayName=Test User,Type=account'
];
ExampleText
| parse TestData with * 'Name=' DisplayName ',' *
| project DisplayName
This will parse all the data between Name= and , to a new column called 'DisplayName'.

You can parse out multiple columns within the same command by matching along the string
let ExampleText = datatable(TestData:string)
[
'Name=Reprise99,UPNSuffix=testdomain.com,AadTenantId=345c1234-a833-43e4-1d34-123440a5bcdd1,AadUserId=cf6f2df6-b754-48dc-b7bc-c8339caf211,DisplayName=Test User,Type=account'
];
ExampleText
| parse TestData with * 'Name=' DisplayName ',UPNSuffix=' DomainSuffix ',AadTenantId=' AzureADTenantId ',' *
| project DisplayName, DomainSuffix, AzureADTenantId
This parses three new columns - DisplayName, DomainSuffix and AzureADTenantId

Remembering that KQL runs its operations sequentially, once we parse we can then parse again on the newly created column.
let ExampleText = datatable(TestData:string)
[
'Name=Reprise99,UPNSuffix=testdomain.com,AadTenantId=345c1234-a833-43e4-1d34-123440a5bcdd1,AadUserId=cf6f2df6-b754-48dc-b7bc-c8339caf211,DisplayName=Test User,Type=account',
];
ExampleText
| parse TestData with * 'Name=' DisplayName ',UPNSuffix=' DomainSuffix ',AadTenantId=' AzureADTenantId ',' *
| project DisplayName, DomainSuffix, AzureADTenantId
| parse DomainSuffix with * '.' TopLevelDomain
| project DisplayName, DomainSuffix, TopLevelDomain, AzureADTenantId
This further parses our domain to find the top level domain, in this case a .com

When using the parse operator, KQL will run through all your rows of data and return even results where there is no match. So depending on your data structure you could end up with many rows of empty data. If we expand our example data to include another row of data, with different names and run the same query you will see empty results.
let ExampleText = datatable(TestData:string)
[
'Name=Reprise99,UPNSuffix=testdomain.com,AadTenantId=345c1234-a833-43e4-1d34-123440a5bcdd1,AadUserId=cf6f2df6-b754-48dc-b7bc-c8339caf211,DisplayName=Test User,Type=account',
'Display=Reprise99,UPN=testdomain.com,AadDirectoryId=345c1234-a833-43e4-1d34-123440a5bcdd1,AadObjectId=cf6f2df6-b754-48dc-b7bc-c8339caf211,Name=Test User,AccountType=account'
]
;
ExampleText
| parse TestData with * 'Name=' DisplayName ',UPNSuffix=' DomainSuffix ',AadTenantId=' AzureADTenantId ',' *
| project DisplayName, DomainSuffix, AzureADTenantId
| parse DomainSuffix with * '.' TopLevelDomain
| project DisplayName, DomainSuffix, TopLevelDomain, AzureADTenantId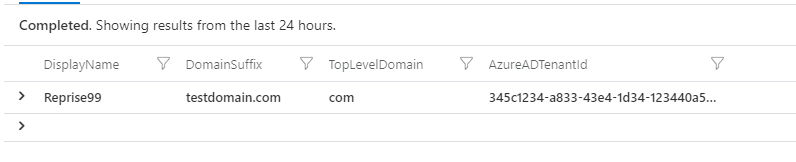
To combat this you can use the 'parse-where' operator, which only returns results where there are matches to your query.
let ExampleText = datatable(TestData:string)
[
'Name=Reprise99,UPNSuffix=testdomain.com,AadTenantId=345c1234-a833-43e4-1d34-123440a5bcdd1,AadUserId=cf6f2df6-b754-48dc-b7bc-c8339caf211,DisplayName=Test User,Type=account',
'Display=Reprise99,UPN=testdomain.com,AadDirectoryId=345c1234-a833-43e4-1d34-123440a5bcdd1,AadObjectId=cf6f2df6-b754-48dc-b7bc-c8339caf211,Name=Test User,AccountType=account'
]
;
ExampleText
| parse-where TestData with * 'Name=' DisplayName ',UPNSuffix=' DomainSuffix ',AadTenantId=' AzureADTenantId ',' *
| project DisplayName, DomainSuffix, AzureADTenantId
| parse DomainSuffix with * '.' TopLevelDomain
| project DisplayName, DomainSuffix, TopLevelDomain, AzureADTenantId
We can see we are back to a single result where we had a match on our parse.

Split separates a string of text into an array based on a delimiter. If we go back to our original test data, we can split based on the comma sign.
let ExampleText = datatable(TestData:string)
[
'Name=Reprise99,UPNSuffix=testdomain.com,AadTenantId=345c1234-a833-43e4-1d34-123440a5bcdd1,AadUserId=cf6f2df6-b754-48dc-b7bc-c8339caf211,DisplayName=Test User,Type=account',
]
;
ExampleText
| extend SplitData = split(TestData,',')
| project SplitData
We will be returned an array with our string split out.

Split is index aware so if your data is in the same order, you can split directly into new columns.
let ExampleText = datatable(TestData:string)
[
'Name=Reprise99,UPNSuffix=testdomain.com,AadTenantId=345c1234-a833-43e4-1d34-123440a5bcdd1,AadUserId=cf6f2df6-b754-48dc-b7bc-c8339caf211,DisplayName=Test User,Type=account',
]
;
ExampleText
| extend Name = split(TestData,',')[0]
| extend DomainSuffix = split(TestData,',')[1]
| extend AzureADTenantId = split(TestData,',')[2]
| extend AzureADUserId = split(TestData,',')[3]
| extend DisplayName = split(TestData,',')[4]
| extend AccountType = split(TestData,',')[5]
| project Name, DomainSuffix, AzureADTenantId, AzureADUserId, DisplayName, AccountType
If we know our data location within the string then we can split it directly into named columns.

Once we have split our data, we can query it as though it was structured from the outset. So if we add a second record to our data, then query on specifc matches we will find what we are after.
let ExampleText = datatable(TestData:string)
[
'Name=Reprise99,UPNSuffix=testdomain.com,AadTenantId=345c1234-a833-43e4-1d34-123440a5bcdd1,AadUserId=cf6f2df6-b754-48dc-b7bc-c8339caf211,DisplayName=Test User,Type=account',
'Name=Reprise103,UPNSuffix=testdomain.com,AadTenantId=331c1234-a841-43e5-1d31-12220a5bcee1,AadUserId=cf6f2df6-b754-48dc-b7bc-c8339caf211,DisplayName=Test User 2,Type=account'
]
;
ExampleText
| extend Name = split(TestData,',')[0]
| extend DomainSuffix = split(TestData,',')[1]
| extend AzureADTenantId = split(TestData,',')[2]
| extend AzureADUserId = split(TestData,',')[3]
| extend DisplayName = split(TestData,',')[4]
| extend AccountType = split(TestData,',')[5]
| project Name, DomainSuffix, AzureADTenantId, AzureADUserId, DisplayName, AccountType
| where Name contains "Reprise99"
We get only one hit, where Name contains "Reprise99", our second record where Name contains "Reprise103" isn't found.
