A math and physics problem, where the student must draw the path of the ball by graphing the x and y positions over time. Live Demo.


const graphWidth = 324;
const graphHeight = 320;

const imageWidth = 907;
const imageHeight = 513.3;

// Functions to pass a point from the graph, and map it on the image

function getX(x) {
  return x * (imageWidth/graphWidth);
}

function getY(y) {
  return y * (imageHeight/graphHeight);
}
  // Setting the height graph's x and y scale

  const TIME_RANGE = [0, 5] // Unit is seconds
  const IMAGE_Y_RANGE = [0.2, 18] // Unit is feet
  const x = d3.scaleLinear().domain(TIME_RANGE).range([0, graphWidth]);
  const y = d3.scaleLinear().domain(IMAGE_Y_RANGE).range([graphHeight, 0]);

  const intialBballValue = [{x: 0, y: 13.5}];
  // Setting the x-position graph's x and y scale

  const TIME_RANGE = [0, 5] // Unit is seconds
  const IMAGE_X_RANGE = [-4.5, 28] // Unit is feet
  const x = d3.scaleLinear().domain(TIME_RANGE).range([0, graphWidth]);
  const y = d3.scaleLinear().domain(IMAGE_X_RANGE).range([graphHeight, 0]);

  const intialBballValue = [{x: 0, y: 19.3}];
The main inspiritation. Crossing Turtles by Desmos.
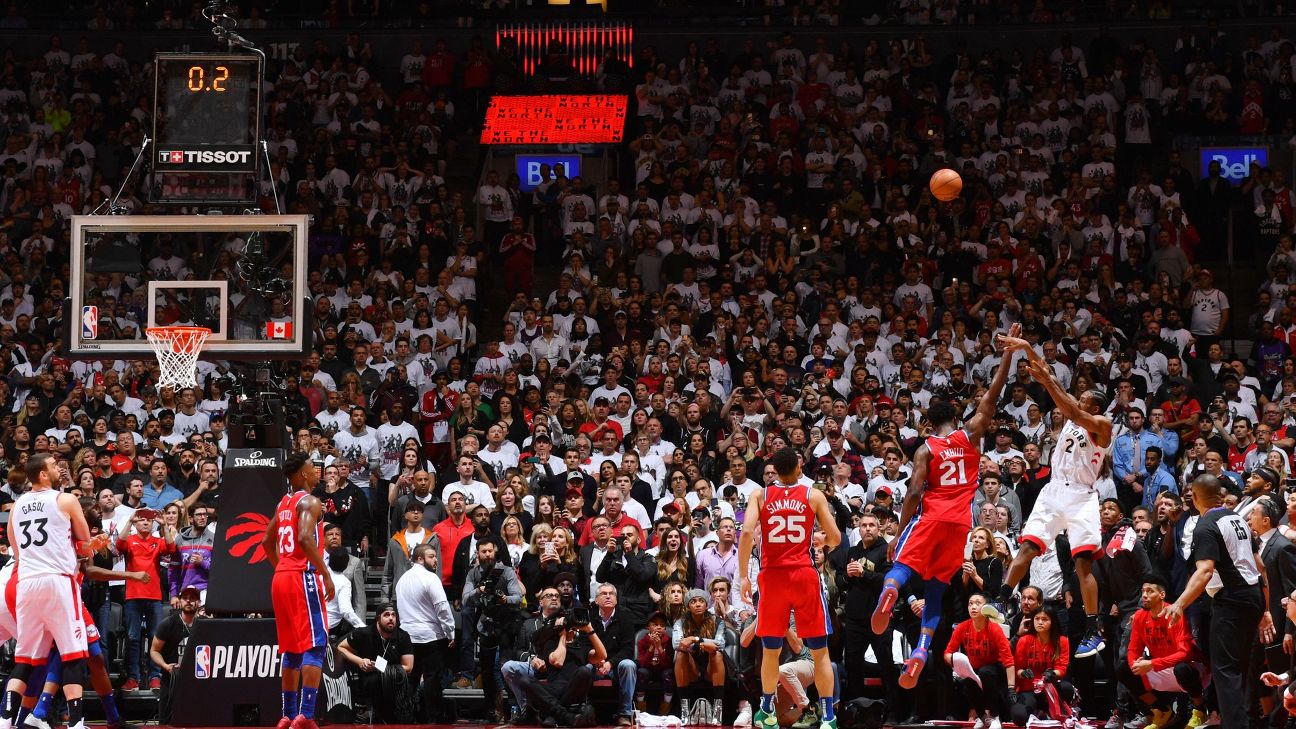
The video of Kawhi Leonard's shot.
Story Reference, which contains the photo.