The connectors in Debezium Server provide JMX metrics that can be used for monitoring with a suitable tool, for example JConsole or Grafana. See section Monitoring in the Debezium documentation for the various connectors, for example here for MySQL. This guide describes the steps required for setting up monitoring for Debezium Server.
JMX monitoring is enabled by passing some options to the Java Virtual Machine (JVM) . Specifically, these are:
-Dcom.sun.management.jmxremote.ssl=false
-Dcom.sun.management.jmxremote.authenticate=false
-Dcom.sun.management.jmxremote.port=<PORT_NUMBER>
-Dcom.sun.management.jmxremote.rmi.port=<PORT_NUMBER>
-Dcom.sun.management.jmxremote.local.only=false
-Djava.rmi.server.hostname=<HOSTNAME>
<PORT_NUMBER> is an available port on the machine running Debezium Server. This can be the same for jmxremote.port and jmxremote.rmi.port, but note that the JMX client connects through jmxremote.port.
<HOSTNAME> is the name of the Debezium Server machine, but for convenience it can be set to 0.0.0.0.
The options are passed to the JVM through environment variable JAVA_OPTS. If you are running Debezium Server as a container, you also need to open the port(s) specified in the options. The Docker command for running Debezium Server looks like this:
docker run -d --name debezium -v $PWD/conf:/debezium/conf \
  -e JAVA_OPTS="-Dcom.sun.management.jmxremote.ssl=false \
                -Dcom.sun.management.jmxremote.authenticate=false \
                -Dcom.sun.management.jmxremote.port=1099 \
                -Dcom.sun.management.jmxremote.rmi.port=1099 \
                -Dcom.sun.management.jmxremote.local.only=false \
                -Djava.rmi.server.hostname=0.0.0.0" \
  -p 1099:1099 debezium/server:2.1.2.Final
Once Debezium Server is running, connect to the JVM through JConsole. In this example, JConsole and Docker are running on the same machine (localhost):

→ Connect
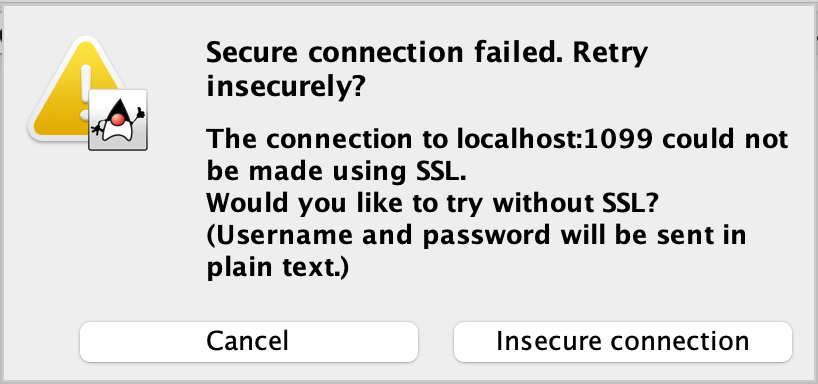
→ Insecure connection

→ MBeans
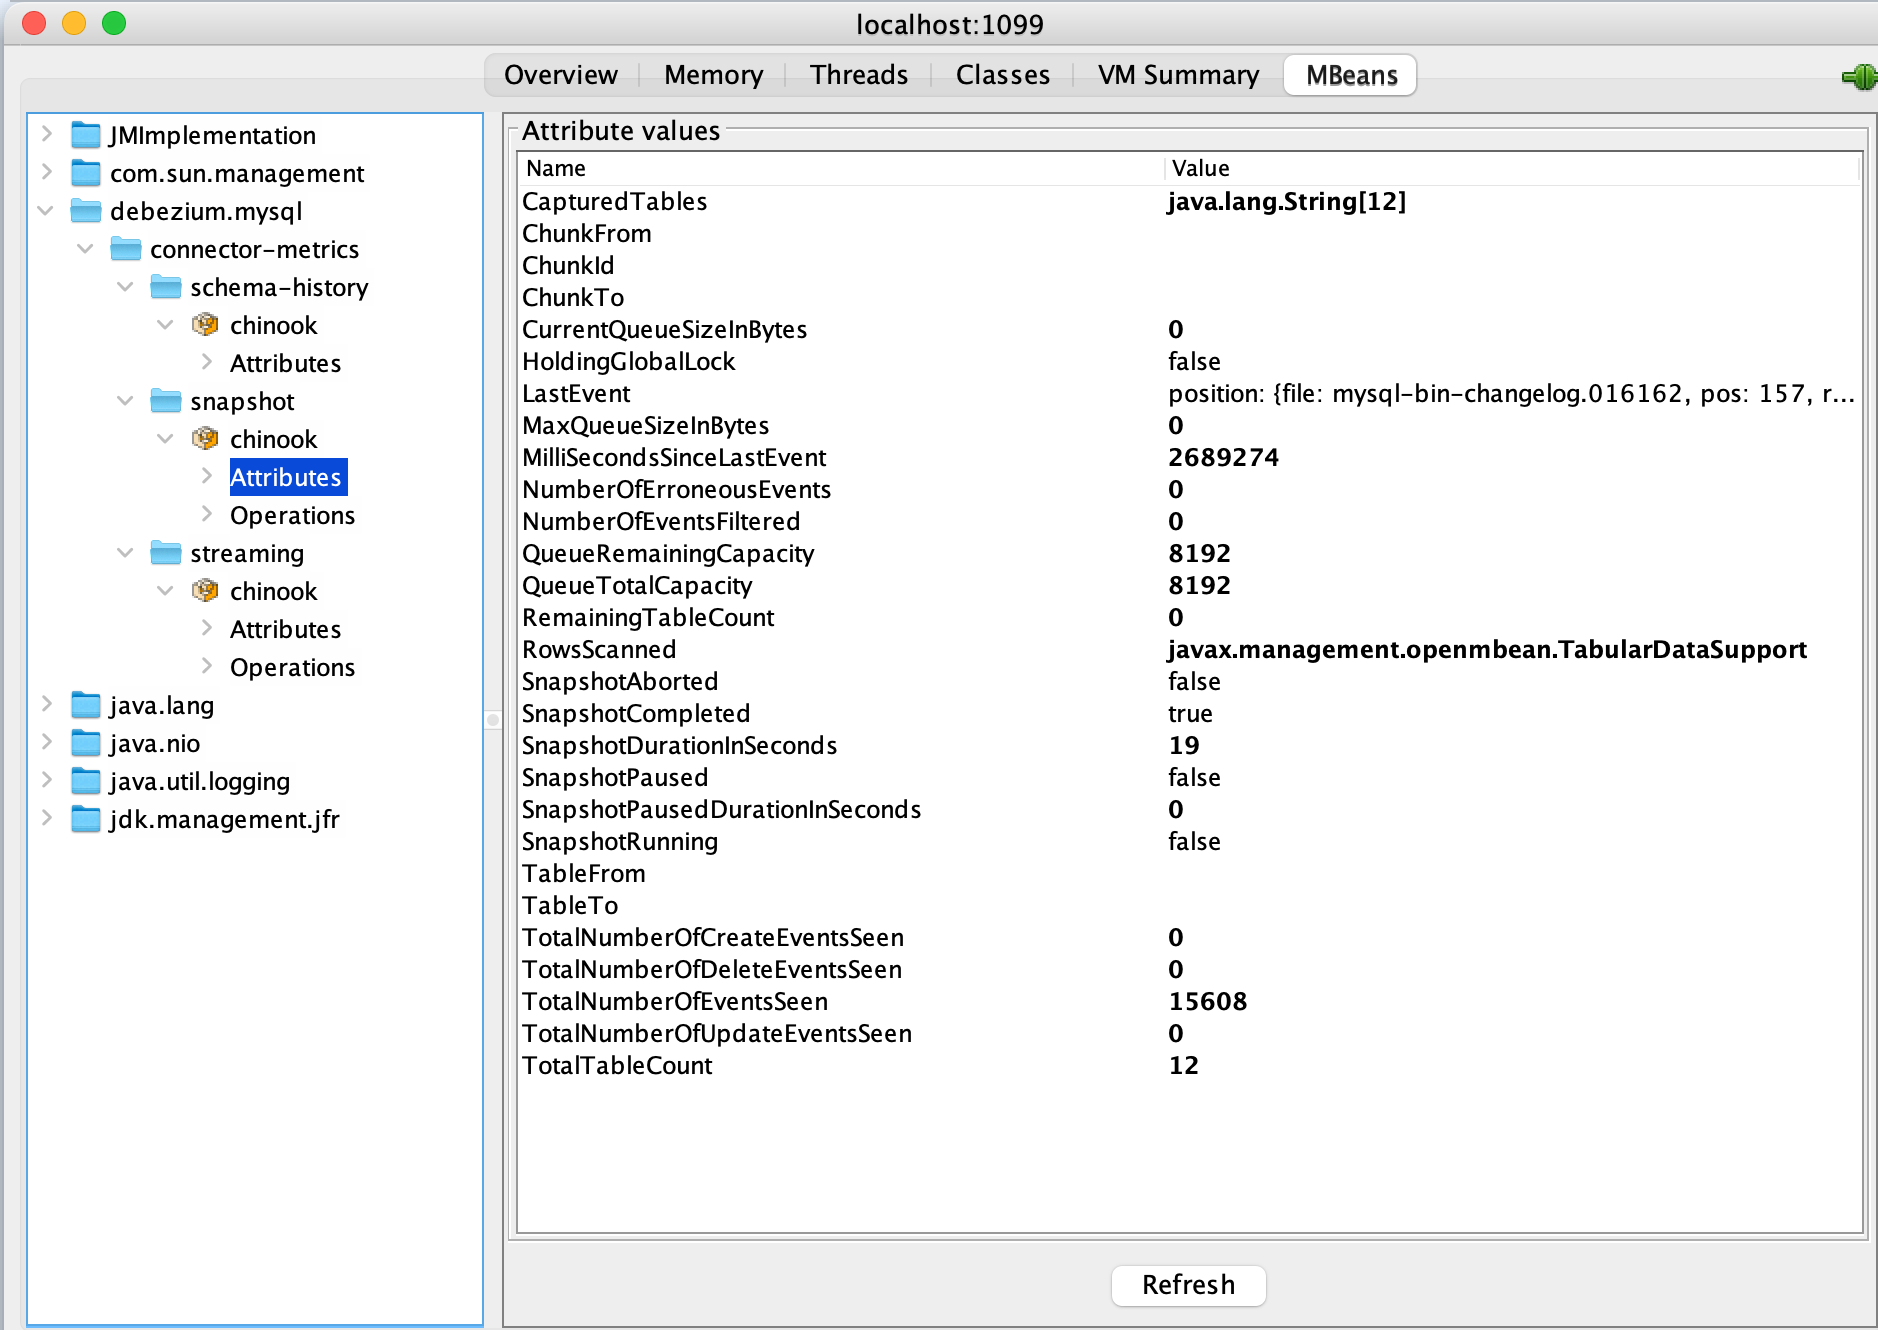
The available MBeans will depend on the connector you are using with Debezium Server. The screenshot above shows the three MBeans for MySQL, but some connectors (for example PostgreSQL) only have two MBeans for snapshot and streaming.
Warning In this scenario, Grafana uses Prometheus as a data source. As Prometheus only supports numeric and boolean data, JMX attributes with a String or String array data type will not be exposed. To view these attributes, use JConsole or another JMX client, instead.
If you want to monitor through Grafana, three additional components are needed:
This guide assumes that all components are running on the local workstation.
The JMX Exporter can be run as a standalone HTTP server, but the recommended method is to use it as a Java agent. If you are running Debezium Server as a container, follow these steps:
-
Copy the java agent jar file to the conf directory that contains the application.properties file for Debezium
cp jmx_prometheus_javaagent-0.18.0.jar conf -
In the conf directory create file config.yaml:
startDelaySeconds: 0 ssl: false lowercaseOutputName: false lowercaseOutputLabelNames: false rules: - pattern: "debezium.([^:]+)<type=connector-metrics, context=([^,]+), server=([^,]+), key=([^>]+)><>RowsScanned" name: "debezium_metrics_RowsScanned" labels: plugin: "$1" name: "$3" context: "$2" table: "$4" - pattern: "debezium.([^:]+)<type=connector-metrics, context=([^,]+), server=([^>]+)>([^:]+)" name: "debezium_metrics_$4" labels: plugin: "$1" name: "$3" context: "$2" -
Add the java agent to the Docker run command:
docker run -d --name debezium -v $PWD/conf:/debezium/conf \
  -e JAVA_OPTS="-javaagent:/debezium/conf/jmx_prometheus_javaagent-0.18.0.jar=12345:/debezium/conf/config.yaml" \
  -p 12345:12345 debezium/server:2.1.2.Final
Note the parameter for mapping port 12345. This can be any free port on your machine.
You can now view the Debezium metrics in your browser at address http://localhost:12345:

Add the JMX Exporter to file prometheus.yml:
global:
  scrape_interval:     15s
  evaluation_interval: 15s

scrape_configs:
  - job_name: "prometheus"
    static_configs:
      - targets: ["localhost:9090"]
  # scrape JMX Metrics Exporter
  - job_name: debezium
    scrape_interval: 5s
    static_configs:
      - targets: ["localhost:12345"]
The job name must be debezium, as this is hard-wired in the Grafana dashboard.
Restart Prometheus and verify the target for Debezium is available (http://localhost:9090, menu item Status > Targets):

Prometheus changes localhost or 127.0.0.1 in the endpoint URL to the machine’s hostname. If you want to access these URLs, simply add the hostname of the machine as an alias for localhost in /etc/hosts.
Currrently, there are two sample Grafana dashboards available, one for MySQL and the other for Oracle. These are based on the dashboard for MySQL available in the Debezium Examples repository. Note that this is a bit outdated and will not work well with the current version of Grafana (9.3.6 as of April 2023).
Download the monitoring dashboard for the Debezium MySQL or Oracle connector from this repository, import the JSON file into Grafana and connect the dashboard to your Prometheus data source.
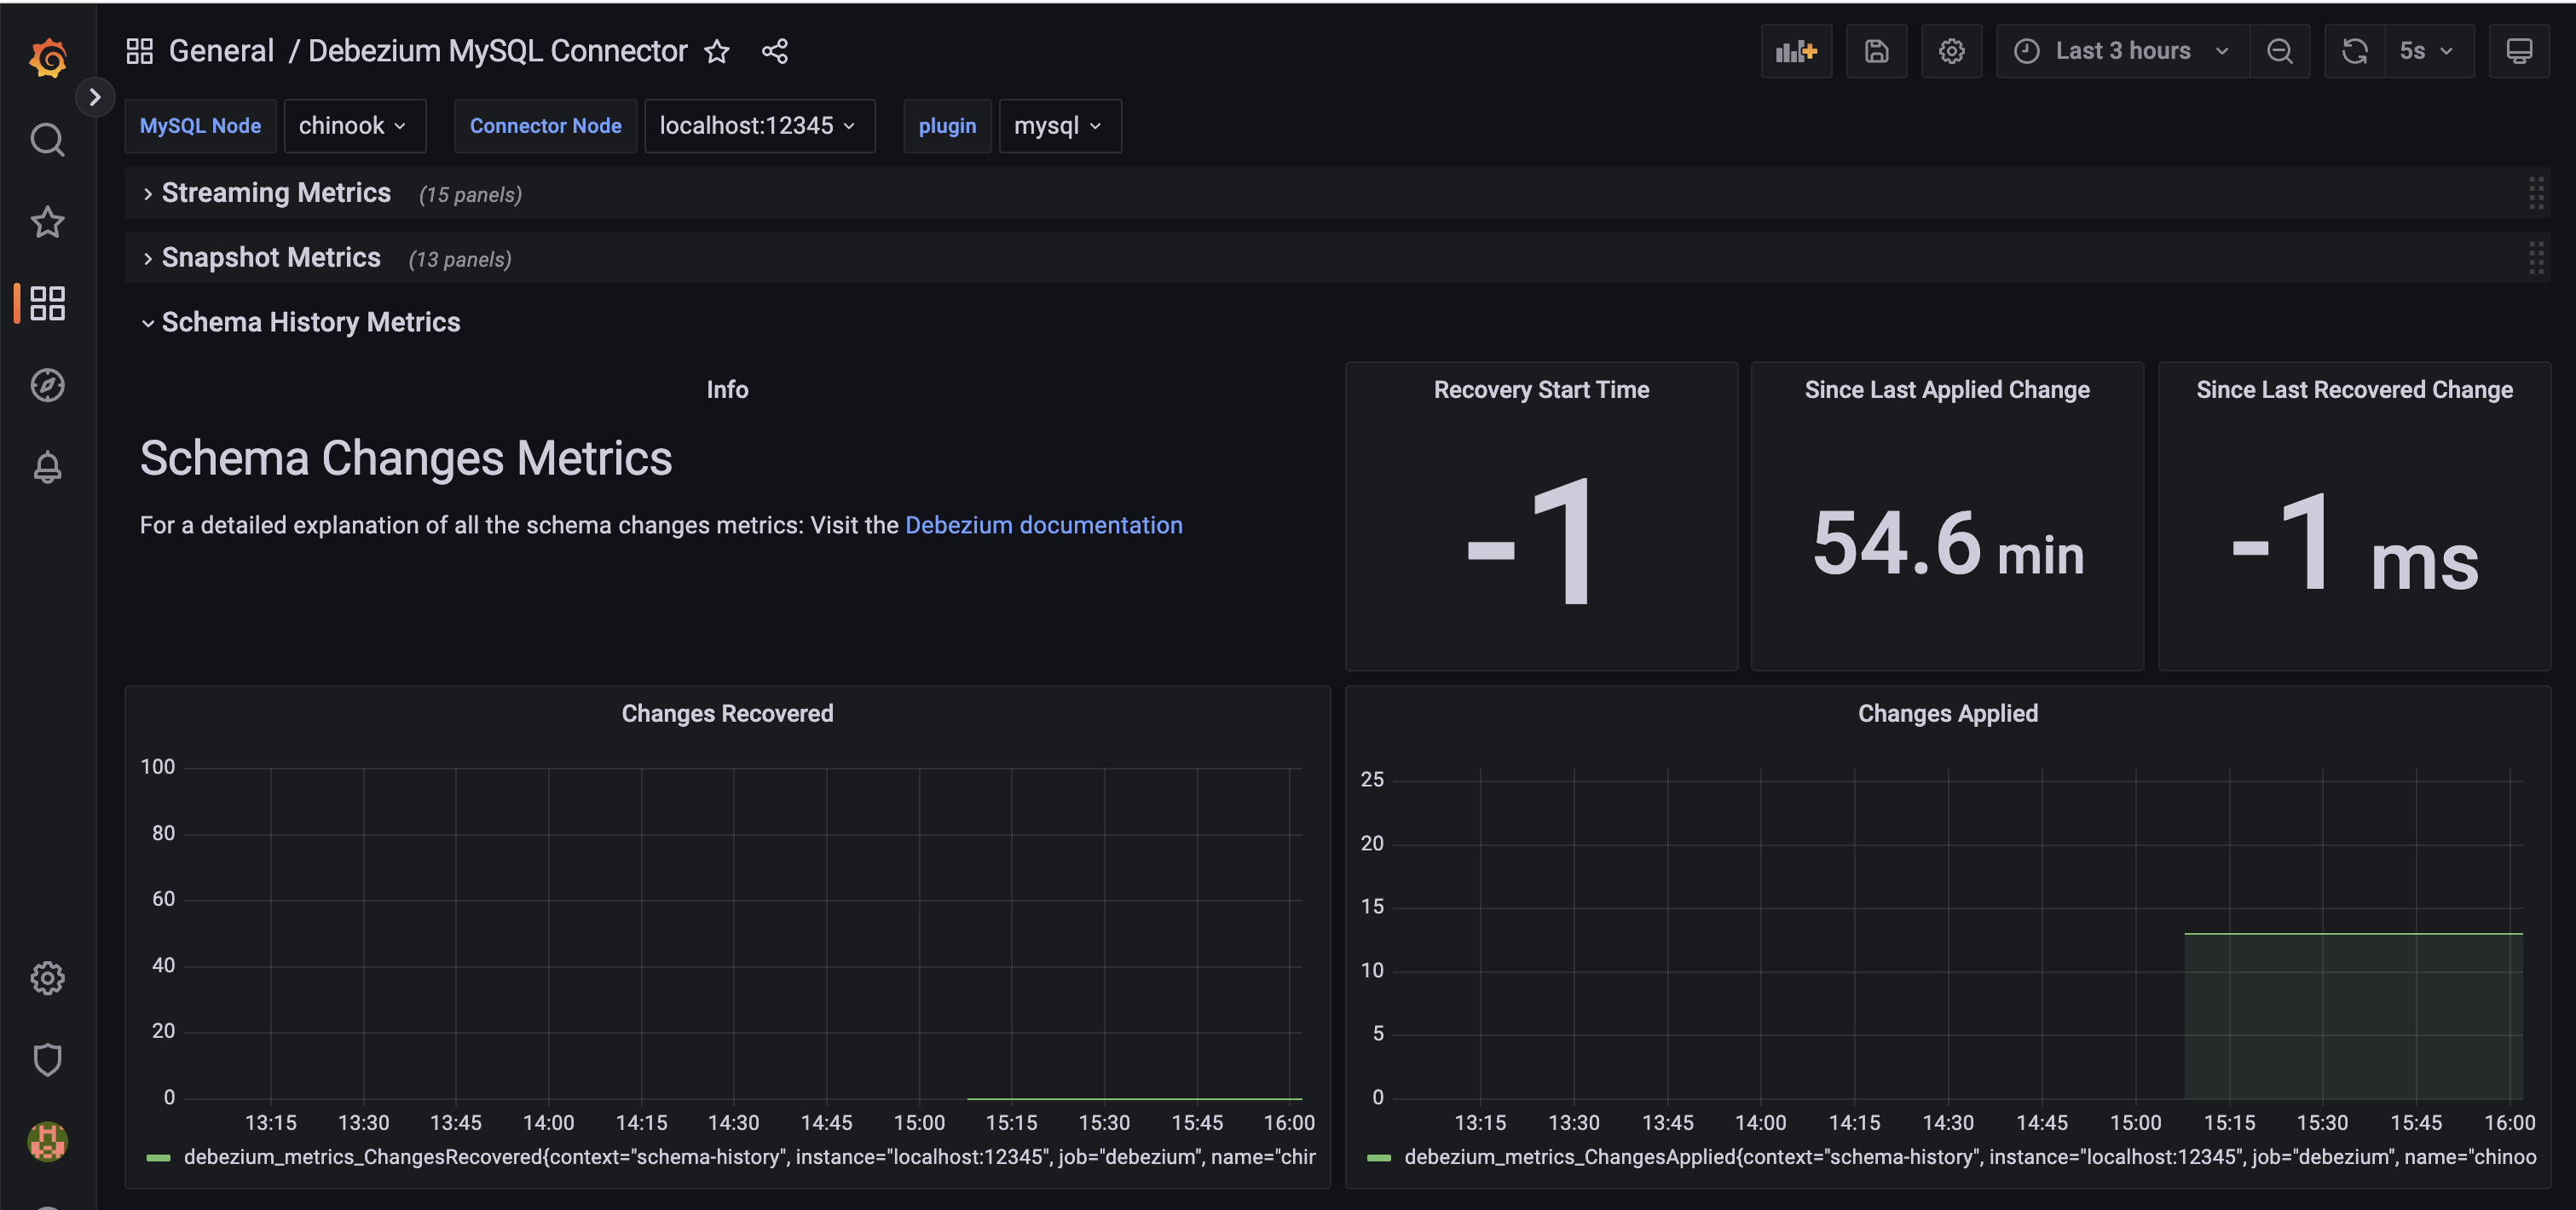
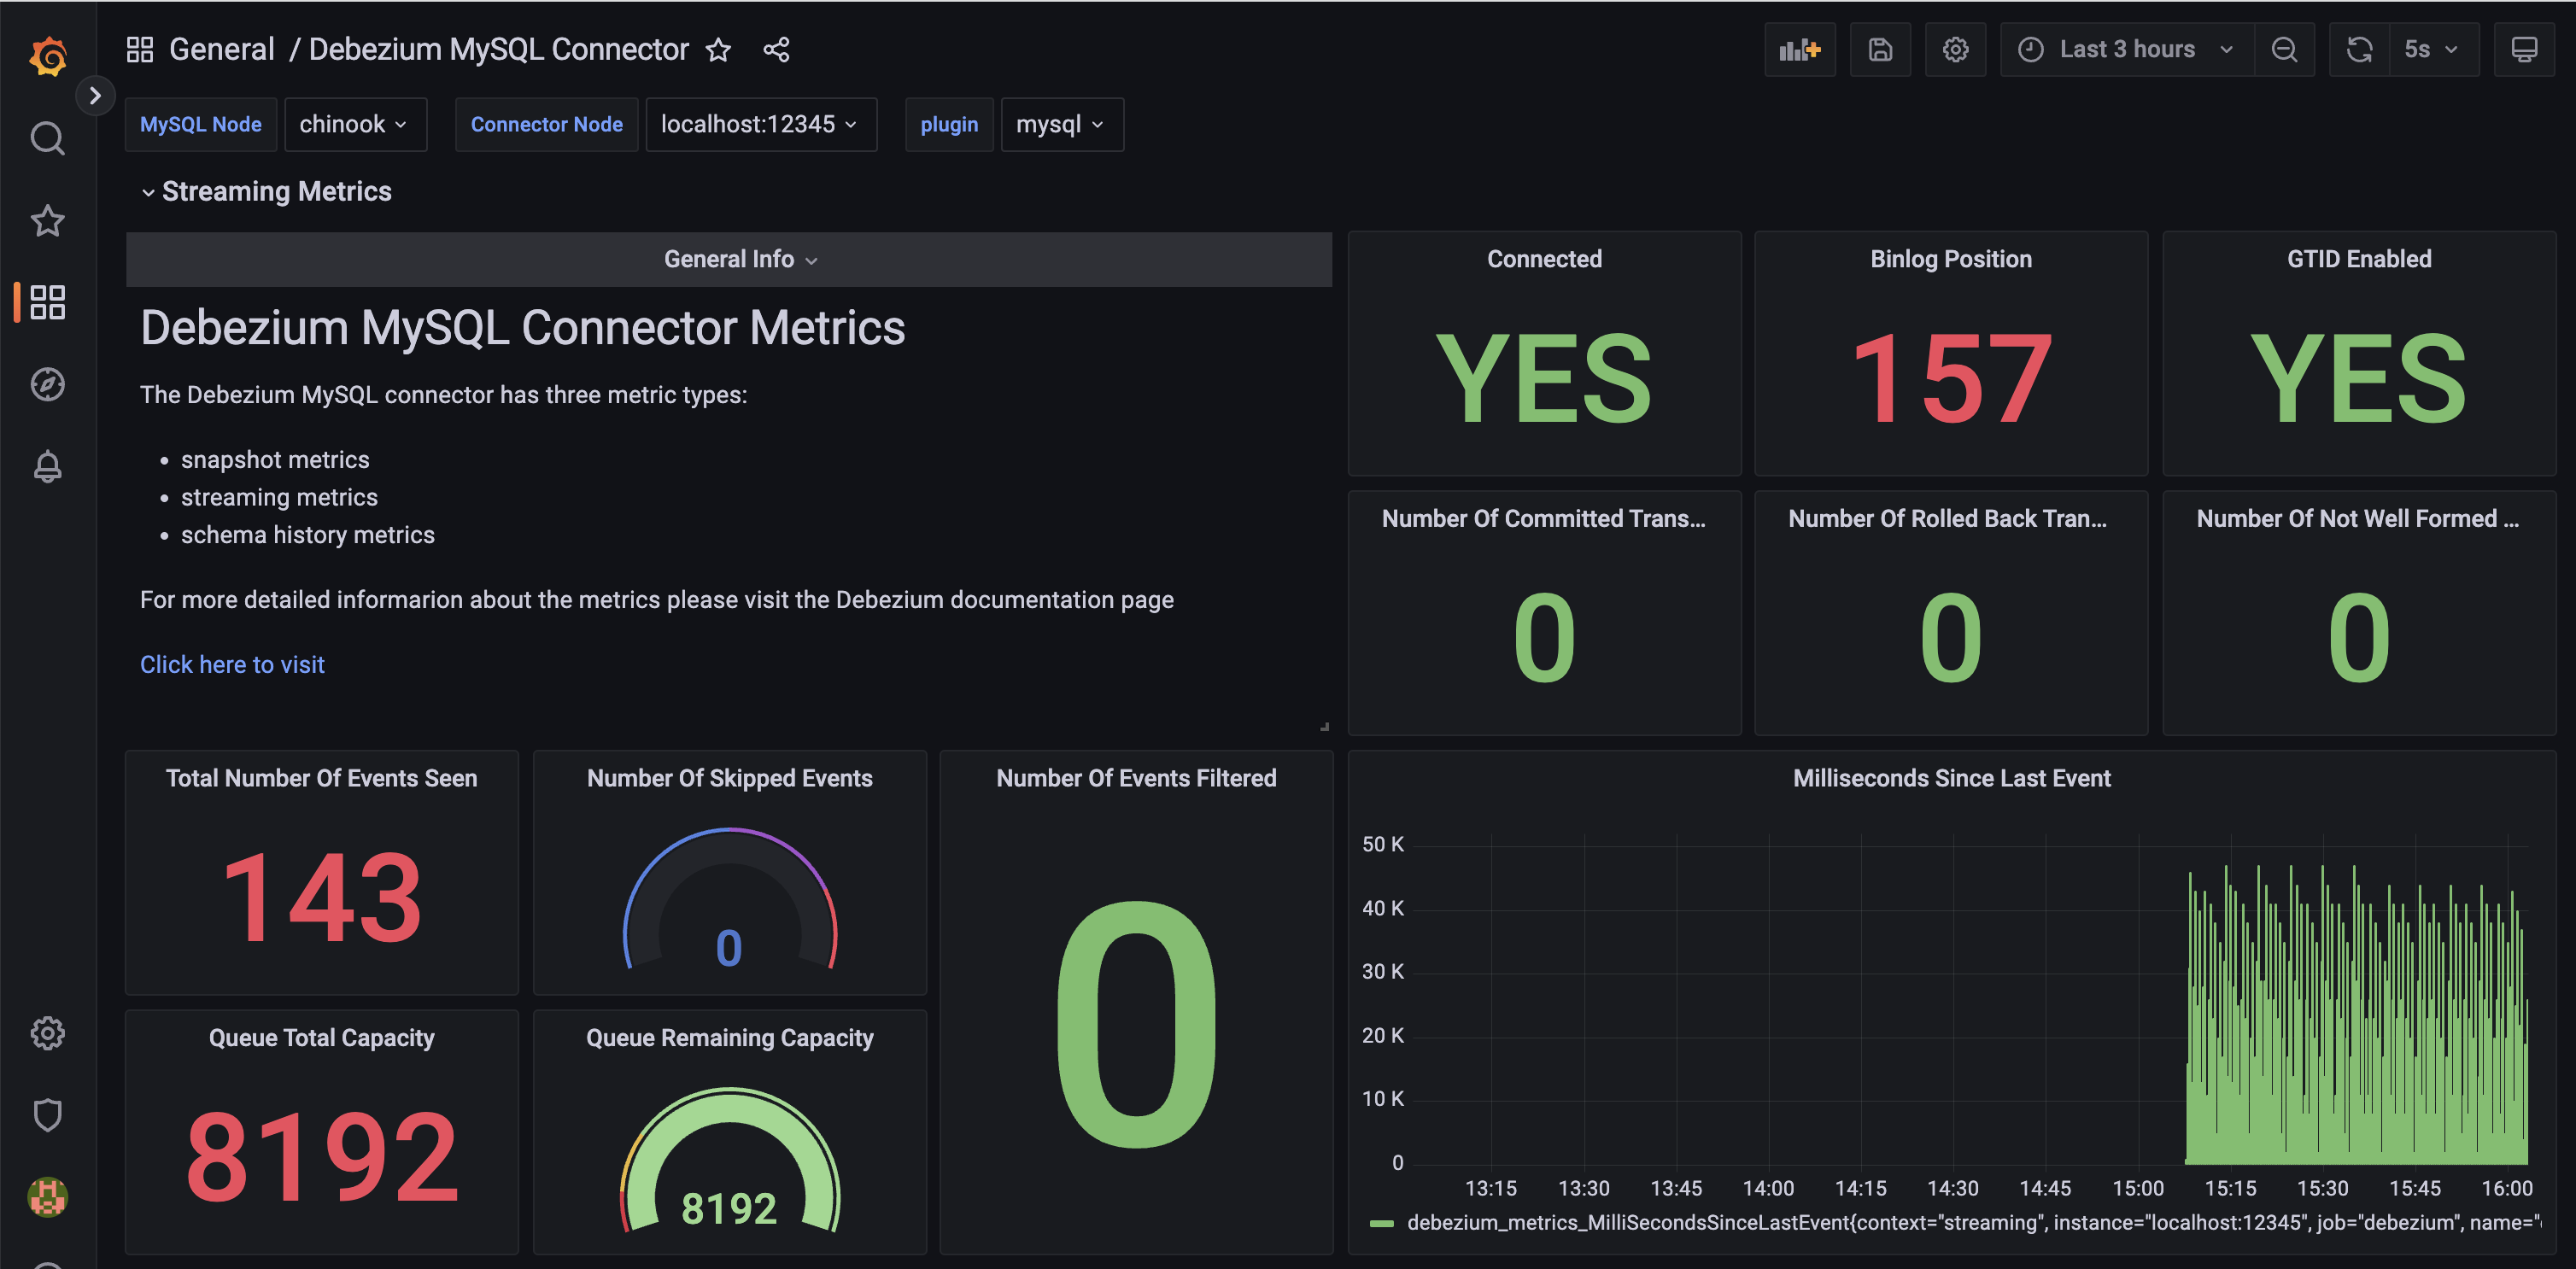
Each dashboard has three sections:
Streaming
Snapshot
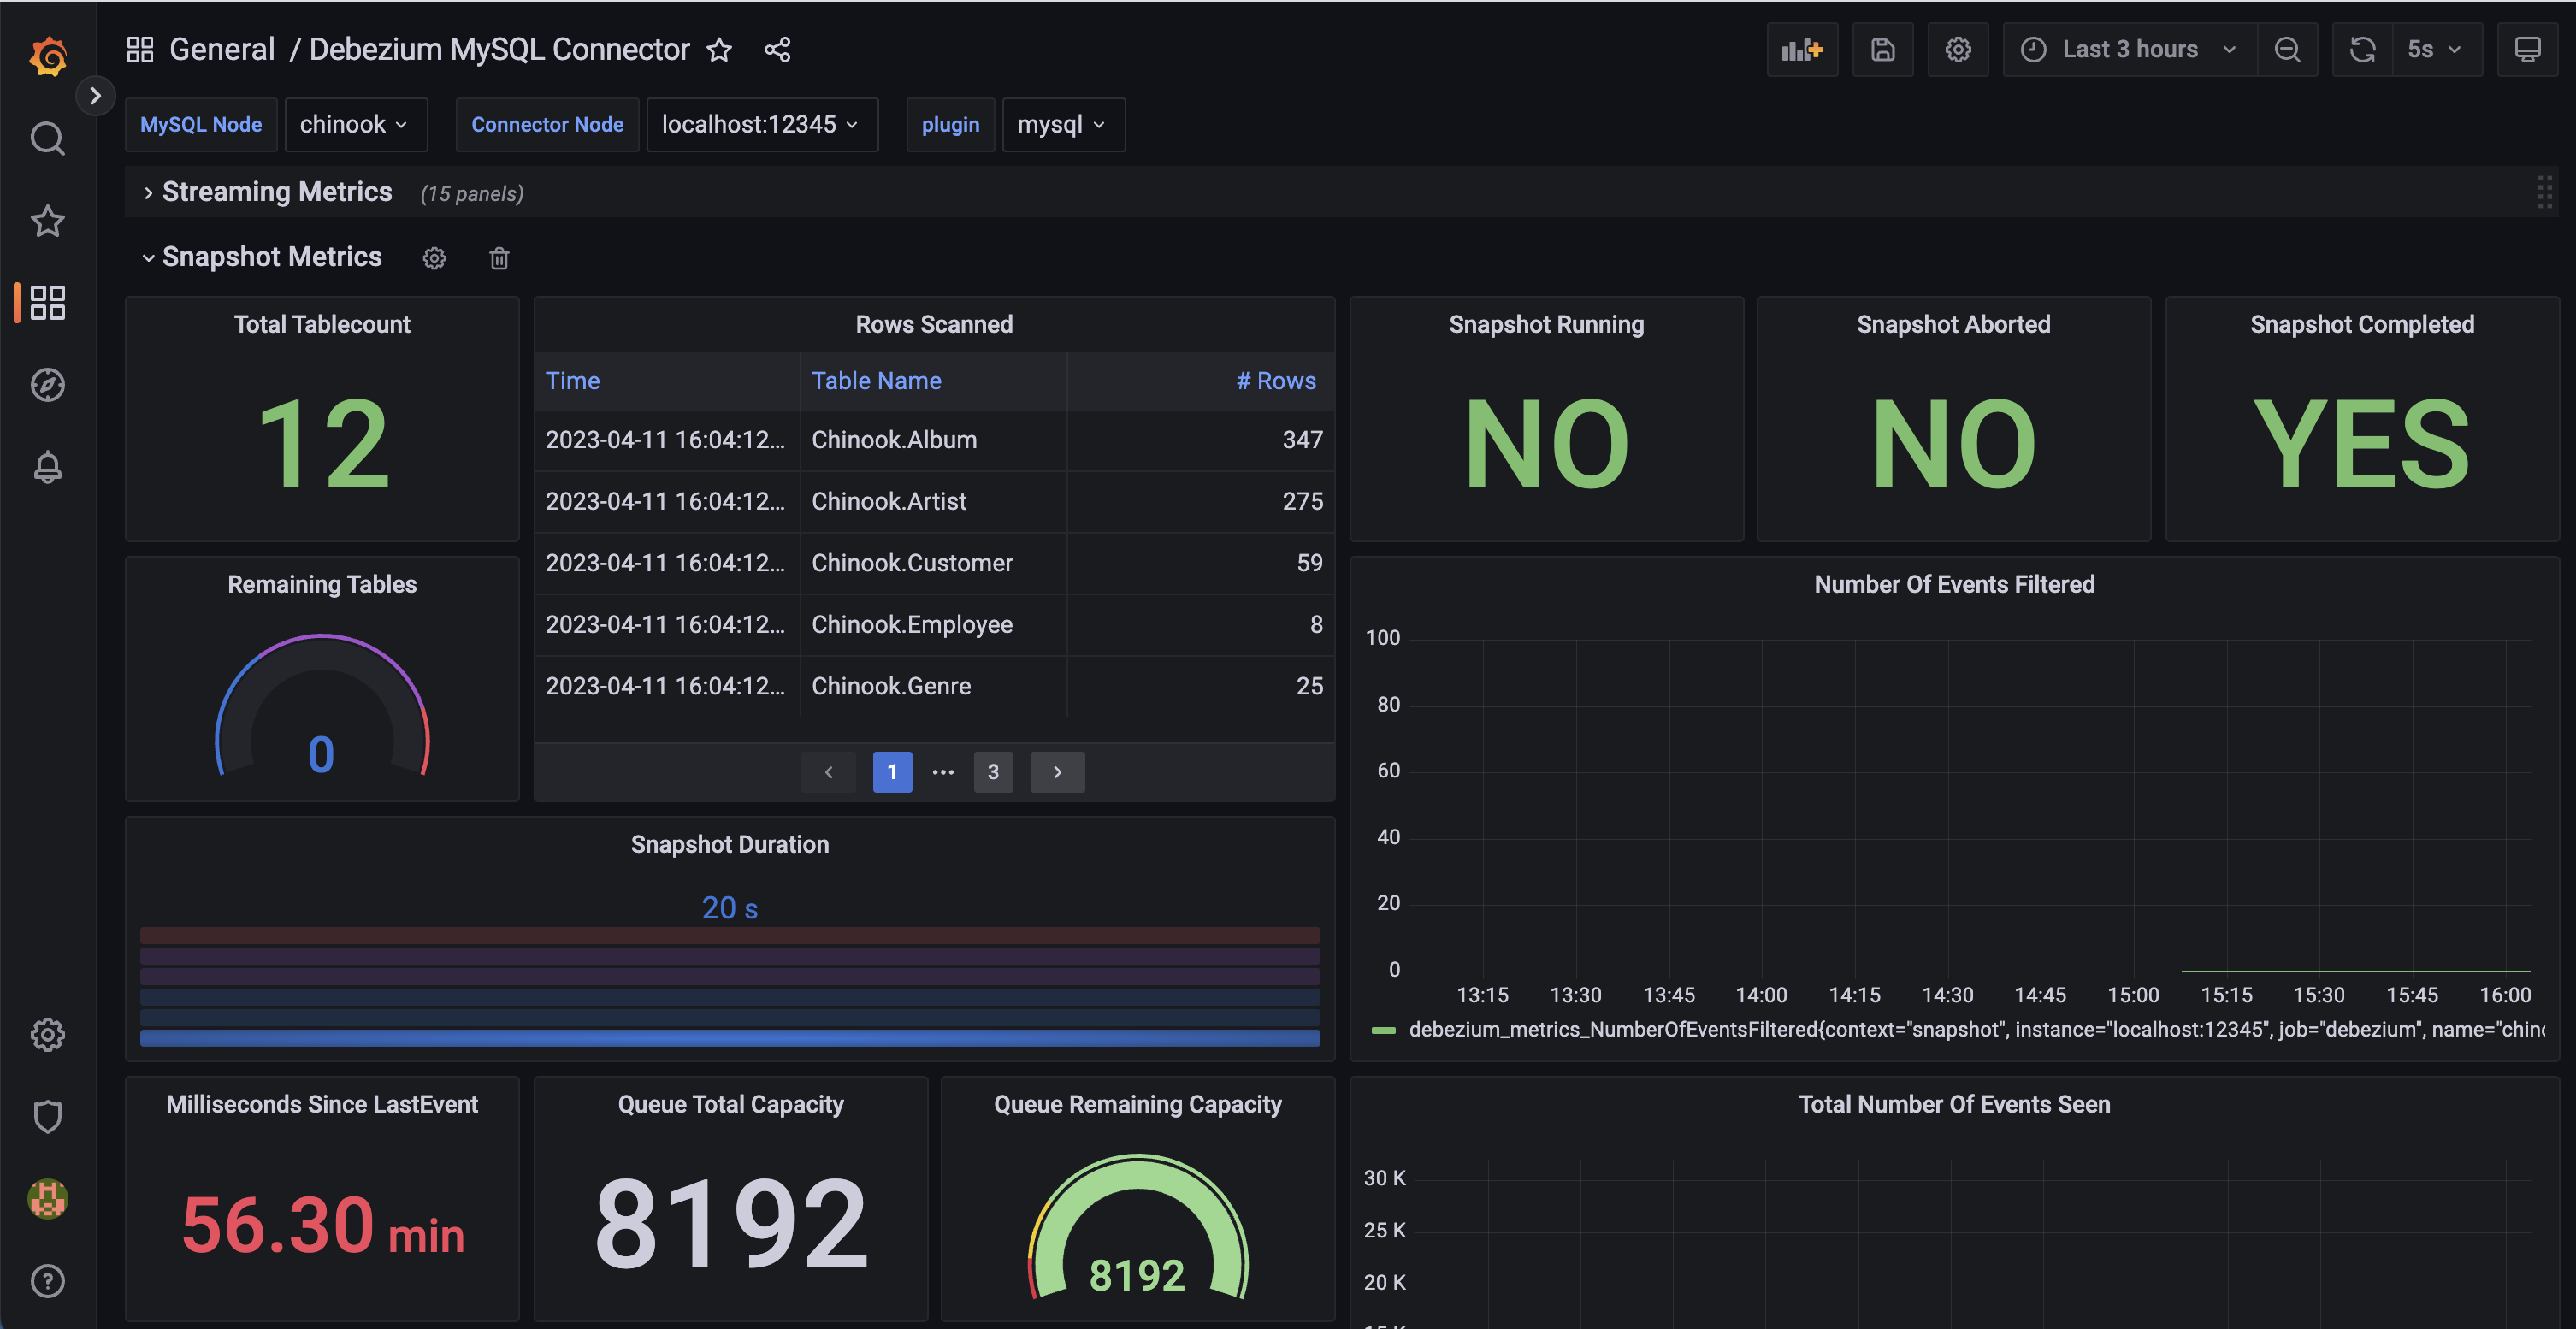
Schema History