Threads
The game uses seven threads:
| ID | Description | Entry | Stack | OSThread* | Arg | Priority | Created At |
|---|---|---|---|---|---|---|---|
| 1 | idle thread | 0x800004E0 | 0x80154670 | 0x801524C0 | null | 0x64 | 0x800004BC (main) |
| 0 | PI manager | 0x800D3170 | 0x80196420 | 0x80195270 | 0x800EB340 | 0x96 | 0x8000054C (thread1_entry) |
| 3 | video | 0x800023E4 | 0x80156820 | 0x80154670 | null | 0x64 | 0x80000598 (thread1_entry) |
| 4 | audio | 0x800028E4 | 0x8015CD30 | 0x8015ABB0 | null | 0x14 | 0x800024C8 (thread3_entry) |
| 5 | game logic | 0x8000277C | 0x8015AB80 | 0x801589D0 | null | 0x0A | 0x80002504 (thread3_entry) |
| 0 | VI manager | 0x800CC638 | 0x80195200 | 0x80194050 | 0x800EA600 | 0xFE | 0x800004E0 (thread1_entry) |
| 9 | crash screen | 0x80004530 | 0x80162D40 | 0x80162790 | null | 0x7F | 0x80004700 (thread1_main) |
The thread IDs are not actually used by the game, so they don't need to be unique. There doesn't appear to be a thread with ID 2.
- idle thread: After creating the other threads, it sets its priority to 0 (lowest) and spins forever. It runs when the CPU has nothing else to do.
- PI manager: Responsible for managing communication with controller and cartridge. Handles all DMA.
- video: Responsible for sending render commands to the RSP.
- audio: Responsible for playing sound.
- game logic: Handles the actual game.
- VI manager: Handles the video interrupt.
- crash screen: Responsible for drawing the crash screen when the game crashes.
Each thread's entry point is a function which accepts a single void* parameter, but only the PI and VI threads use the parameter. Curiously, thread 1 passes its own parameter (which is null) as thread 3's parameter, where it's never used. These functions never return.
0x800EB3B0 is the pointer to the currently executing OSThread.
0x800EB3A8 is a few pointers to OSThreads, which might be the schedule queue. Sometimes 0x800EB3A0 appears here too, but there doesn't appear to be a valid thread here.
The following Gameshark codes will enable a resource meter at the bottom of the screen:
- 810DC520 0001 (enable debug mode)
- 810DC662 0001 (enable resource meters, requires debug mode)
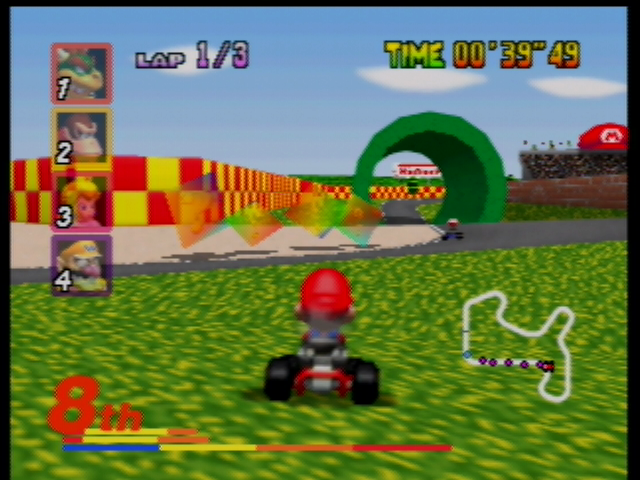
This draws two colored bars, each with three parts: red for the video thread, yellow for the audio thread, and orange for the game logic thread. They show the CPU time used by each thread on the current and previous frame. (XXX which is which?) They may not display properly in some emulators.
The third row is a scale, showing the 25%, 50%, 75% and 100% CPU usage intervals.