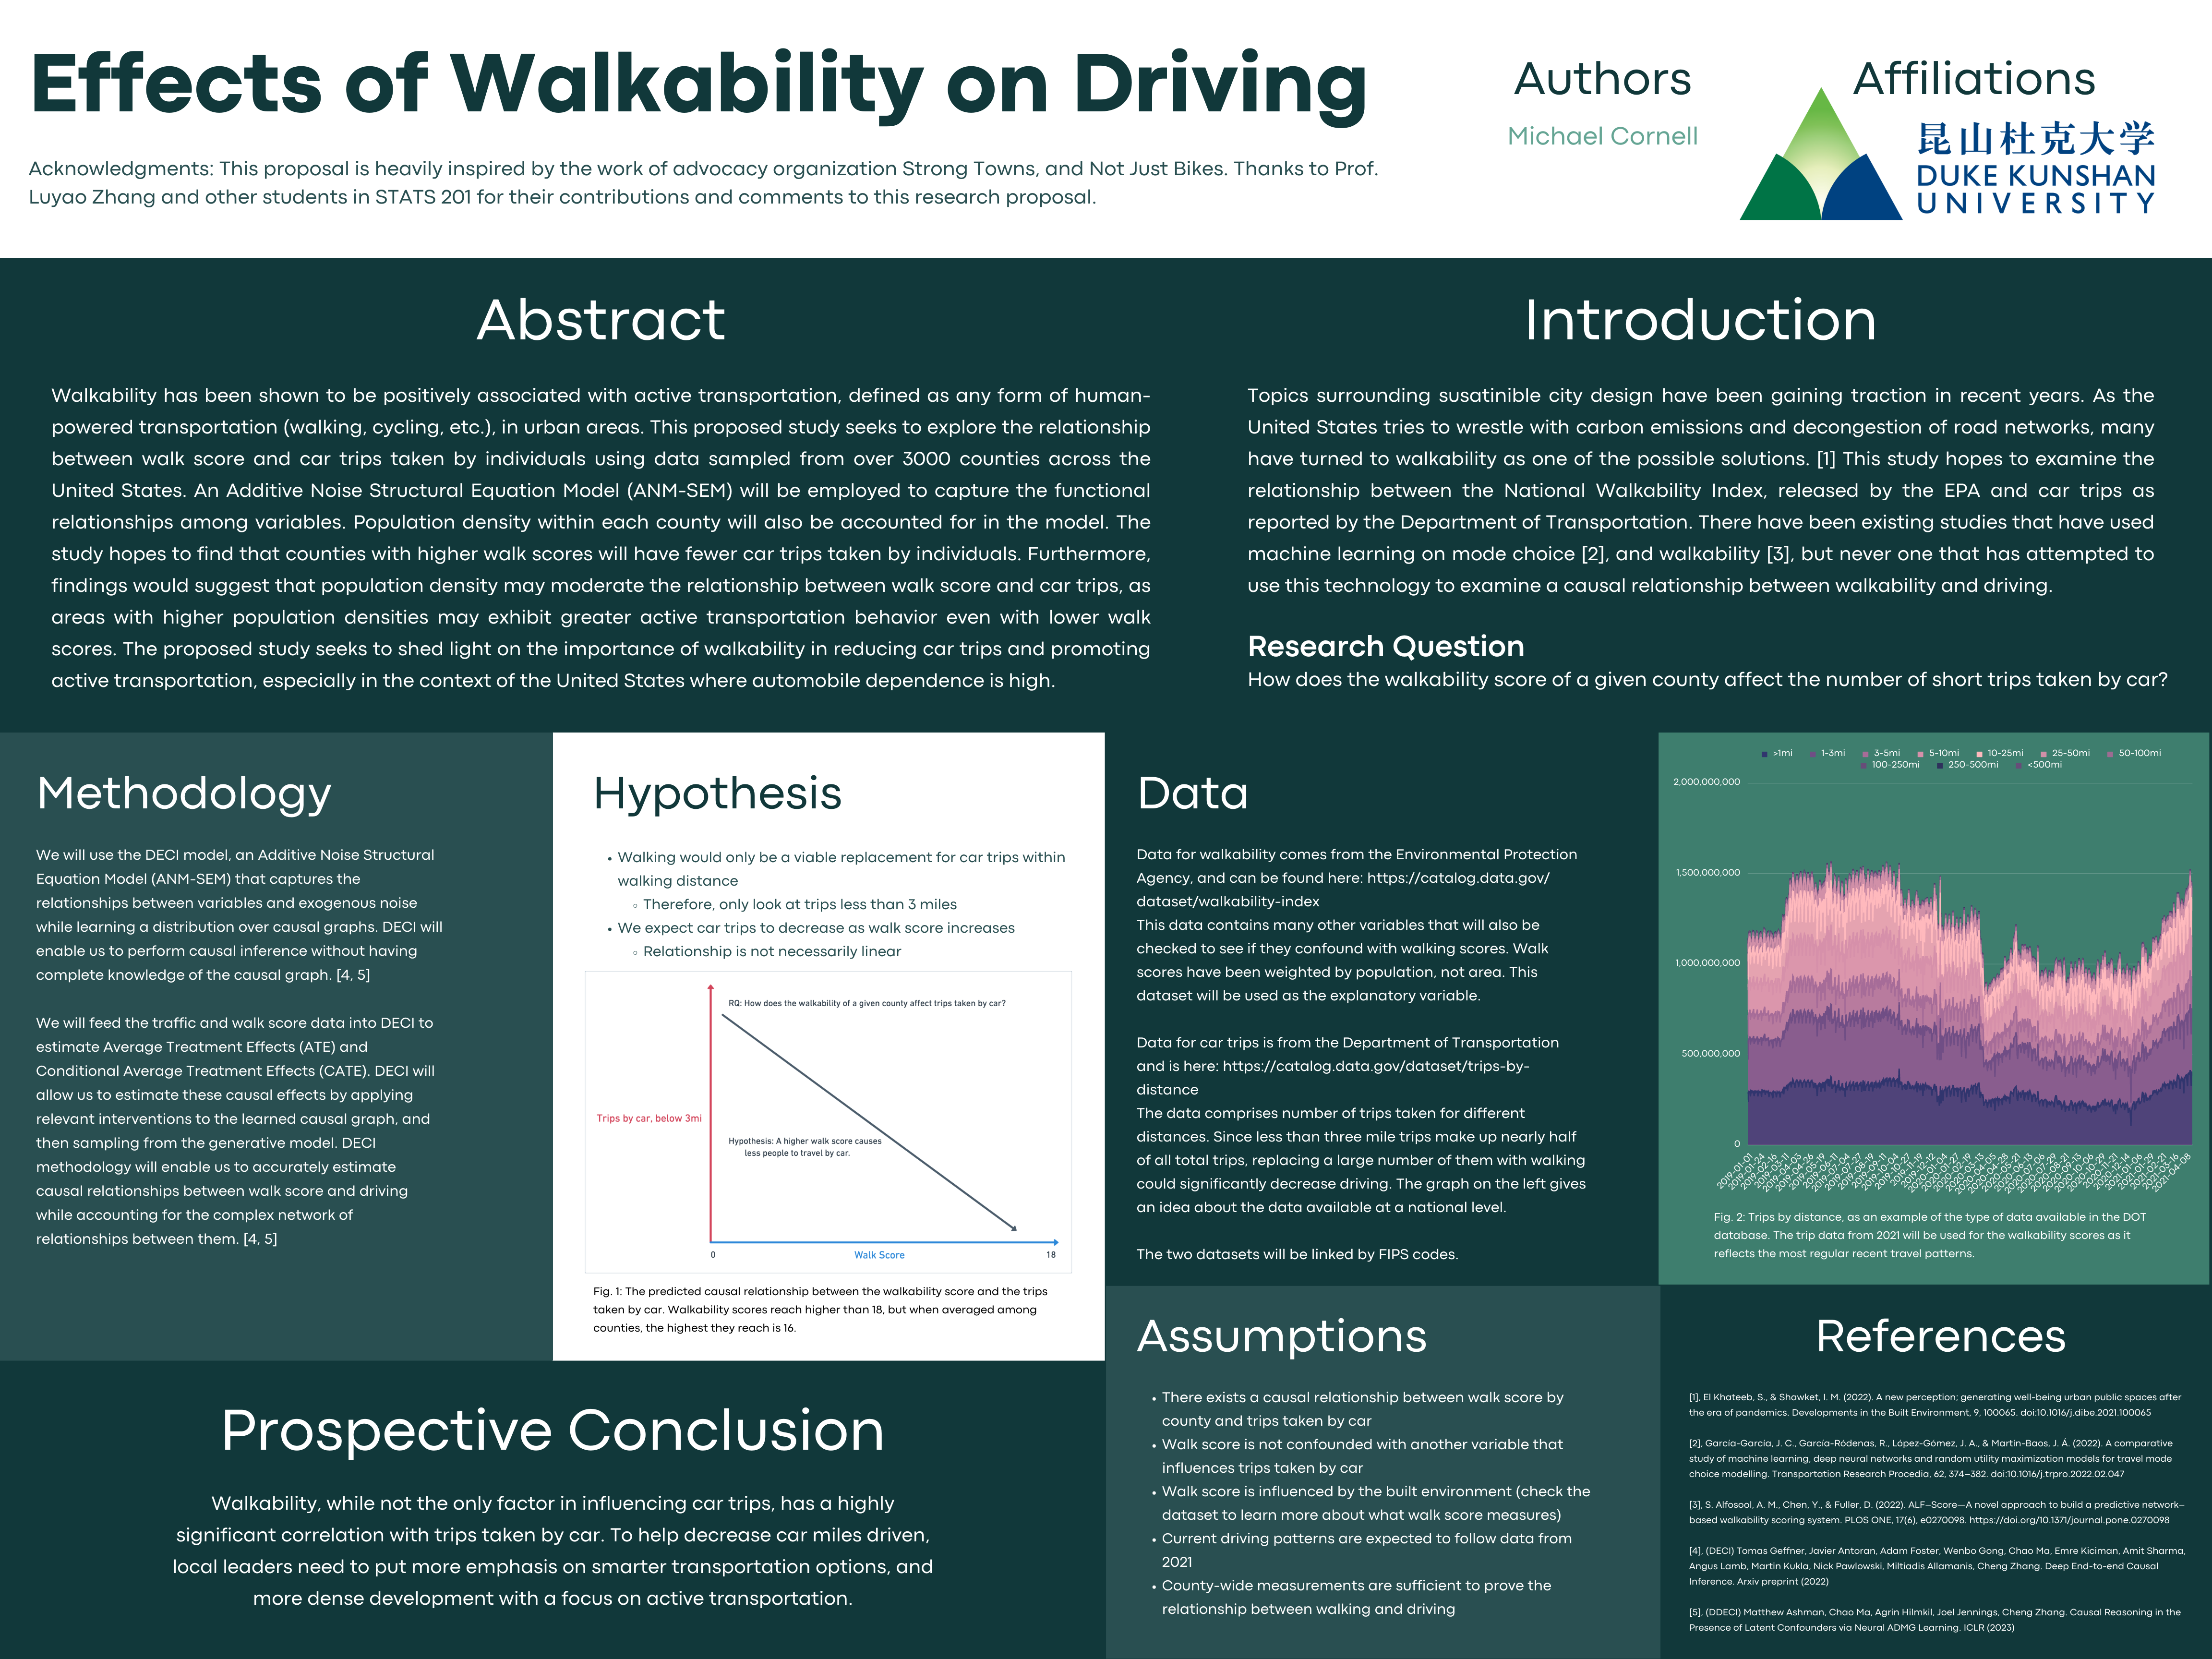
Figure No.1. A poster showing the inital research design.

-
Author: Michael Cornell, Computation and Design - Computer Science Track, 2026, Duke Kunshan University
-
Instructor: Prof. Luyao Zhang, Duke Kunshan University
-
Disclaimer: Submissions to Problem Set 2 for STATS201 Introduction to Machine Learning for Social Science, 2023 Spring Term (Seven Week - First) instructed by Prof. Luyao Zhang at Duke Kunshan University.
-
Acknowledgments: Many thanks to Professor Luyao Zhang for her careful instruction and to Colden Johnston for his thoughful feedback on my project.
-
Project Summary:
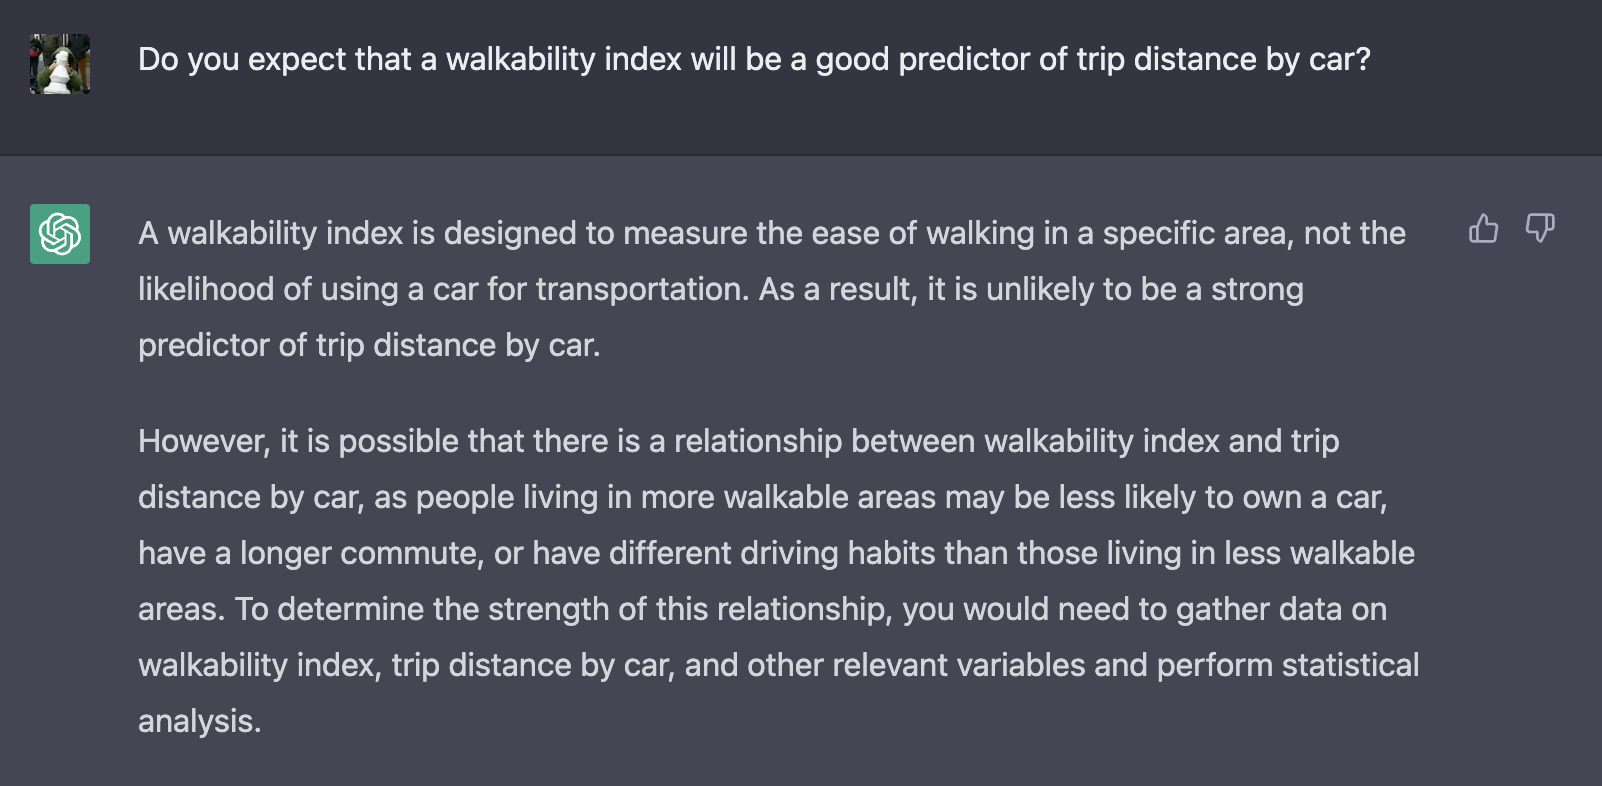
Figure No.2. ChatGPT's answer for how it thinks a walkability index will affect trips taken by car. Note that ChatGPT correctly identifies the existance of cofounding variables, such as density.
- Background and Motivation: Topics surrounding susatinible city design have been gaining traction in recent years. As the United States tries to wrestle with carbon emissions and decongestion of road networks, many have turned to walkability as one of the possible solutions. [1]
- Research Question: How does the walkability score of a given county affect the number of short trips taken by car?
- Application Scenario: The intended Application Sceanrio was evvery county in the United States, however, due to time and processing power constraints, results were only analyzed for the state of New York. The data is cleaned and ready for further analysis though.
- Methodology: Microsoft's ShowWhy full Causal package was used to analyze the data. Factors such as income and car prevelancy were accounted for.
- Expected Results: We expect to see a decrease in trips by car as walkability score increases.
- Intellectual Merit: This research helps give local officals justification for increasing density and making walkability a priority, leading to happier and healthier lives.
| Data Links | Data Description | |
|---|---|---|
| Raw Data | Trips by Distance | The Bureau of Transportation Statistics (BTS) collected data |
| Walkability Score | National Walkability Index, released by the EPA | |
| Queried Data | Queried Data | Data has been cleaned using pandas, ready for processing. |
| Processed Data | Processed Data | Model details and graph relationships. Includes a model file for retesting. |
First, install and run Microsoft's ShowWhy software, and follow the instructions for Causal Discovery.
- More information is available here
The datasets were too large to be uploaded to GitHub, so they must be downloaded from the links above.
Next, run all of the code found in this Jupyter Notebook to properly clean the data. Otherwise, the final cleaned dataset can be obpatined here
Finally, use ShowWhy to process the Causal Discovery.
Jupyter Notebook - Only used for data cleaning.
Here's the process taken in Microsoft ShowWhy to produce the results. First, all variables in the dataset were added and a model was generated to see how the machine learning model though the variables interacted.
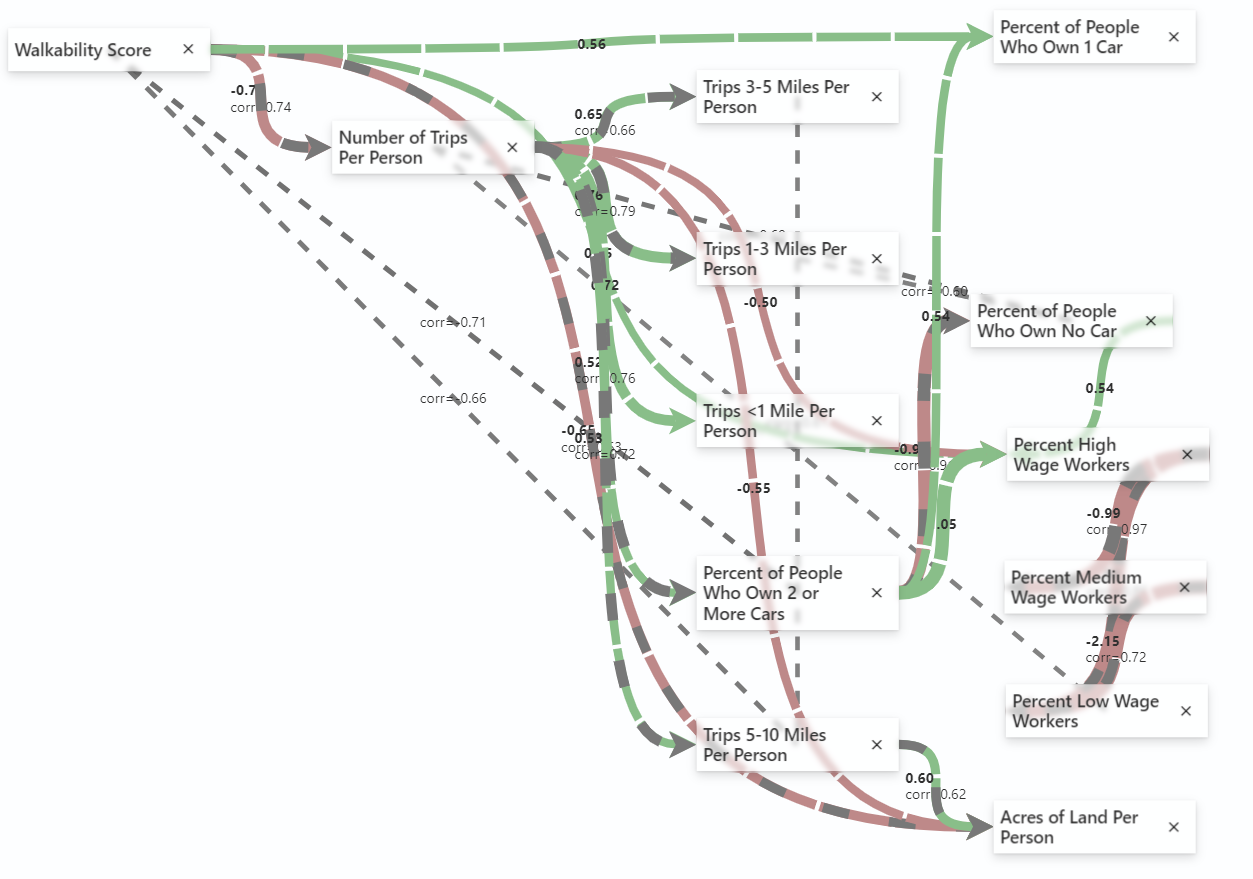
Figure No.3. The inital model spit out my Microsoft ShowWhy. The model is far too complex to be able to discern any important information.
It is evident that this model is far from perfect. To help simplify, we will focus on only two confounding factors: wealth, and car ownership. To do this, we include variables that measure the percentage of those without cars, and those classified as having a high income. However, after doing this, our model still isn't perfect. There is a strong causal relationship between Walkability and Trips under a Mile. However, looking at Figure 4, we can see that this relationship should be discarded.
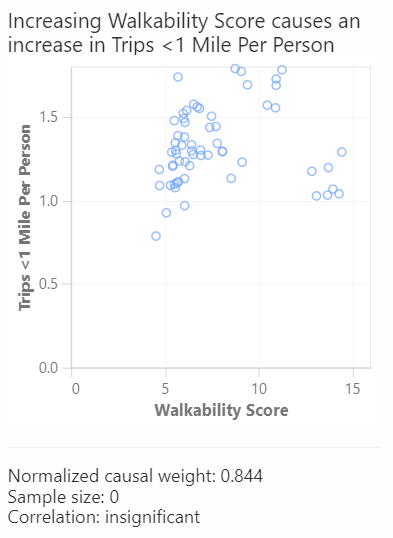
Figure No.4. Graph of Walkability Score on Trips Per Person Under 1 Mile. Note the cluster of points for Walkability Scores greater than 12.
An area with a Walkability Score under 12 is still not very walkable. Therefore, although ShowWhy initially picks up on a very strong correlation, the cluster of outliers leads us to discard this relationship.
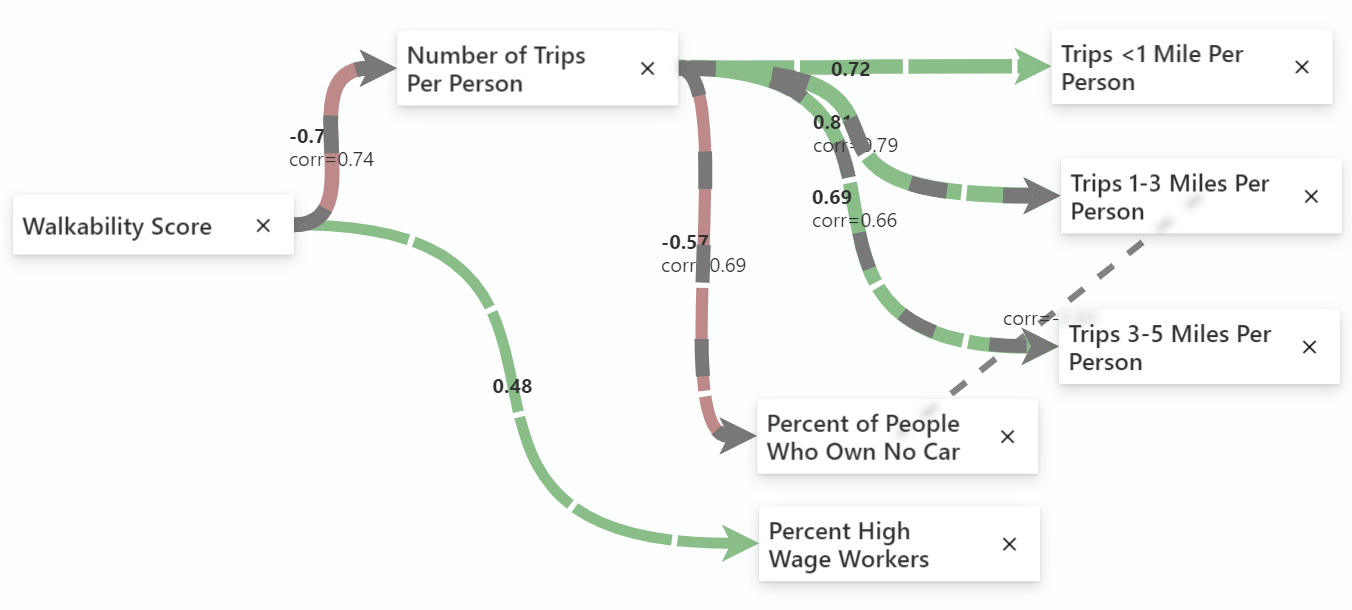
Figure No.5. The final model used. Note that although "High Wage Workers" and those who "Own No Car" are predicted by Walkability Score and Number of Trips per Person, they do not have a significant effect on the resultant variables.
- Trips By Distance: https://catalog.data.gov/dataset/trips-by-distance
- Walkability Score: https://catalog.data.gov/dataset/walkability-index
- ShowWhy: https://github.com/microsoft/showwhy
[1], El Khateeb, S., & Shawket, I. M. (2022). A new perception; generating well-being urban public spaces after the era of pandemics. Developments in the Built Environment, 9, 100065. doi:10.1016/j.dibe.2021.100065
[2], García-García, J. C., García-Ródenas, R., López-Gómez, J. A., & Martín-Baos, J. Á. (2022). A comparative study of machine learning, deep neural networks and random utility maximization models for travel mode choice modelling. Transportation Research Procedia, 62, 374–382. doi:10.1016/j.trpro.2022.02.047
[3], S. Alfosool, A. M., Chen, Y., & Fuller, D. (2022). ALF–Score—A novel approach to build a predictive network– based walkability scoring system. PLOS ONE, 17(6), e0270098. https://doi.org/10.1371/journal.pone.0270098
[4], (DECI) Tomas Geffner, Javier Antoran, Adam Foster, Wenbo Gong, Chao Ma, Emre Kiciman, Amit Sharma, Angus Lamb, Martin Kukla, Nick Pawlowski, Miltiadis Allamanis, Cheng Zhang. Deep End-to-end Causal Inference. Arxiv preprint (2022)
[5], (DDECI) Matthew Ashman, Chao Ma, Agrin Hilmkil, Joel Jennings, Cheng Zhang. Causal Reasoning in the Presence of Latent Confounders via Neural ADMG Learning. ICLR (2023)
[6] Microsoft ShowWhy Causal Analysis Software https://github.com/microsoft/showwhy