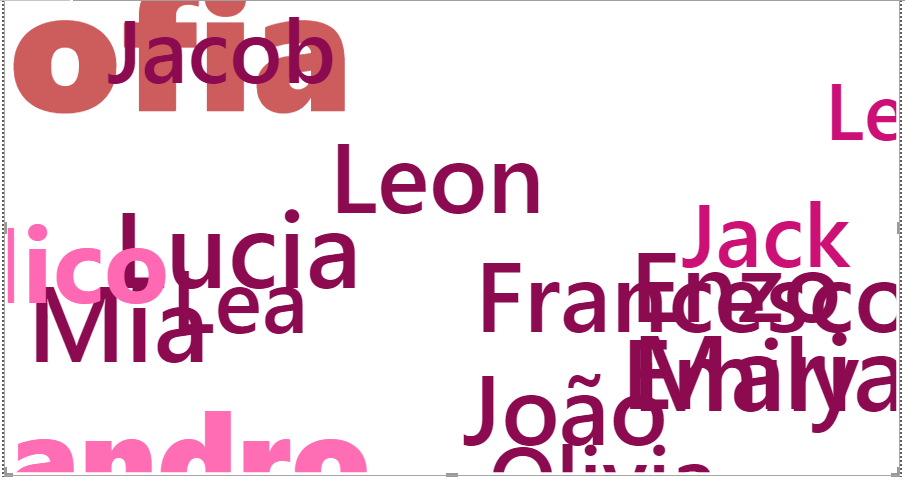
CSS/HTML visuals for Power BI dashboards
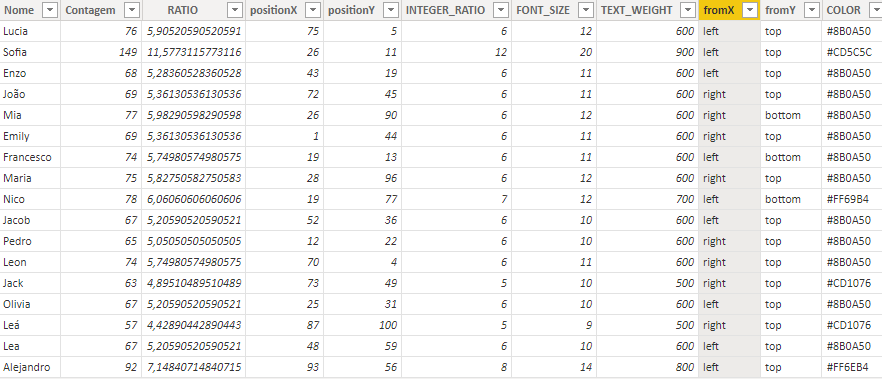
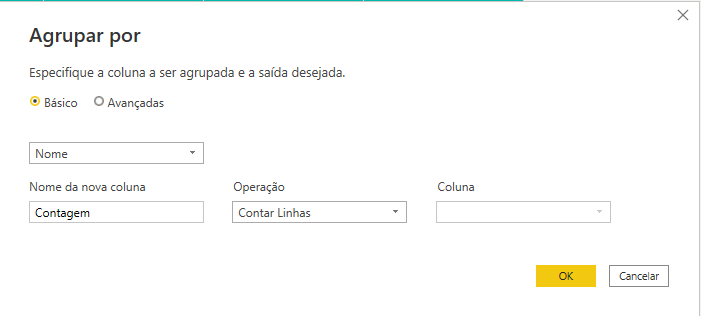
NOME = name and CONTAGEM = count
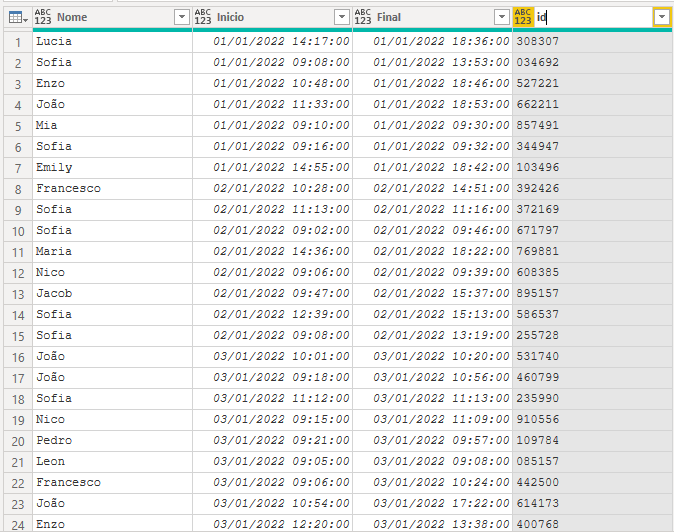
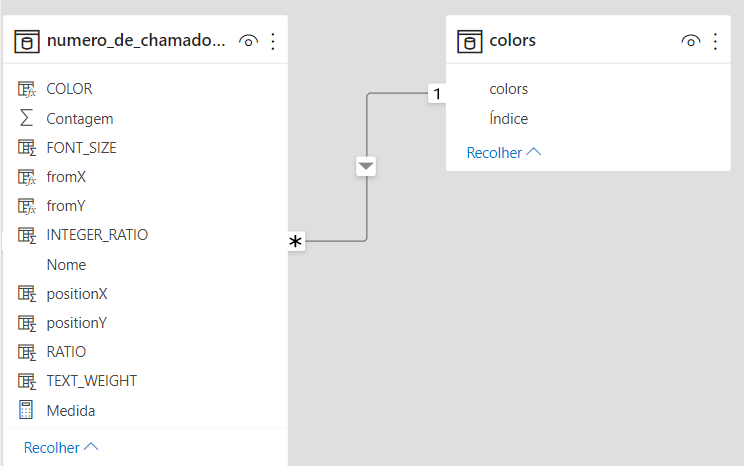
remember that this database model is gererated using another database with the folowing format
The base of all other calculated columns. Both are made using PowerQuery's GroupBy function passing the "name" column as comparission column and count lines as operation.
The percentage of the count in relation to the total data
power BI calculated formula (DAX)
RATIO =
    VAR TOTAL = SUM(database_name[count])
    VAR PERC = (database_name[count] / TOTAL) * 100
    RETURN PERC
TOTAL is a measure that simply sums all the occurrences.
this is a random position from 0 to 100 generated using DAX in both axis; It will be used to set to the name a random initial position at the screen.
power BI calculated formula (DAX)
positionX = RANDBETWEEN(0,100)
positionY = RANDBETWEEN(0,100)
utility column that can be replaced by Ratio
power BI calculated formula (DAX)
INTEGER_RATIO = ROUNDUP(numero_de_chamados_por_nome[RATIO], 0)
In this case it's being used ROUNDUP, that rounds the number up, but there are three Round formulas available in DAX:
- ROUNDUP
- ROUNDDOWN
- ROUND
Font size created to represent the name's percentage, without being too much great or small
power BI calculated formula (DAX)
    FONT_SIZE = if(
         numero_de_chamados_por_nome[RATIO] * 2 < 20,      // logical test
         ROUND(numero_de_chamados_por_nome[RATIO] * 2, 0), // value if true
         20                                                // value if false
     )
power BI calculated formula (DAX)
    TEXT_WEIGHT = IF(
        numero_de_chamados_por_nome[INTEGER_RATIO] * 100 > 900, // logical test
        900,                                                    // value if true
        numero_de_chamados_por_nome[INTEGER_RATIO] * 100        // value if false
    )
selects from which side of the axle the position X and position Y will be applied
method: power BI calculated formula (DAX)
    fromX =
    VAR CHOICE = RANDBETWEEN(1,2)            // creates a binary random choice
    RETURN IF (CHOICE = 1, "left", "right")  // converts the binary choice into CSS-readable values
    fromX =
    VAR CHOICE = RANDBETWEEN(1,2)           // creates a binary random choice
    RETURN IF (CHOICE = 1, "top", "bottom") // converts the binary choice into CSS-readable values
Select the color the will be used to represent that ratio
power BI calculated formula (DAX) + model relationship
if you have a set of colors and want to test them for yourself just fill this column manually, otherwise, be sure that you have a table with columns and indexes as the folowing:
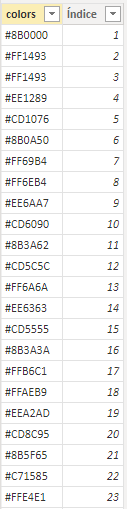
once you have it you can create a relationship beetween those indexes and a numeric columns on the database model:
COLOR = LOOKUPVALUE(colors[colors], colors[Índice], [INTEGER_RATIO])
[MISSING]