It is a step-by-step approach of visualizing the dataset of mass shooting by cleaning the data ,data wrangling and plotting(visualizing) various entities to obtain useful results Mass Shootings in the United States of America (1966-2017) The US has witnessed 398 mass shootings in last 50 years that resulted in 1,996 deaths and 2,488 injured. The latest and the worst mass shooting of October 2, 2017 killed 58 and injured 515 so far. The number of people injured in this attack is more than the number of people injured in all mass shootings of 2015 and 2016 combined. The average number of mass shootings per year is 7 for the last 50 years that would claim 39 lives and 48 injured per year.
Firstly we need to know about the dataset.So,

There are 323 shootings and 21 features in the dataset.
S# - Shooting# - descending order
Title - Description about the shooting
Location - location of the mass shooting
Date - date of shooting
Incident Area - Area where shooting occurred
Open/Close Location - Whether the location is closed or opened
Target - Targeted shooting or random one? If Targeted, who was targeted
Cause - cause for the shooting
Summary - brief summary of the shooting. Who shot and the background etc.
Fatalities - how many were dead during/after the shooting
Injured - how many were injured during/after the shooting
Total victims - Fatalities + Injured
Policeman Killed - Number of policeman killed
Age - Age of the gunman
Employeed (Y/N) - Was the gunman employed
Employed at - If employed, employment details of the gunman
Mental Health Issues - Was the gunman mentally ill?
Race - race of the gunman
Gender - gender of the gunman
Latitude - locations latitude
Longitude - locations longitude
Let's see the missing values first

There are 45 missing locations, 62 missing incident areas and 5 missing Target. a) Let's try to derive the location from summary. My logic is based on the assumption that some titles have city and state separated by comma and some titles just have the state.

b) Next we will make state names from updated locations we have now.We will extract the abbreviated state names and and name them in full form.

c) Now let's update the redundant values i.e. data cleaning i) Cleaning column gender
 ==>
==>

Likewise doing it for columns Race, Mental Health Issues, Cause, open/close Location ii) In case of less redundant values we will group them by our use. Cleaning column Incident area.
 ==>
==>

Likewise doing it for columns Target.
Now it's the time to visualize our data for which we have done all of the above shit and derive results from it. So what are we waiting for. Let's Go.

We can see that there is a highly change in shootings from 2015 onwards as compared to all other previous years.
Let's categorise Mass shooting over the years based on Fatalities, Injured, Total Victims and No of shootings.

We can see that there is a massive change in all 4 categories in the after years.
Maybe there is a connection between shootings and cause. Let's see it.
No of Shootings

Total victims in the shootings

Mass Shootings Vs cause

We can see that the No of shootings are more in case of cause of pyscho and terrorism and the total no of victims are more in case of terroism

We can see that in both the cases i.e. no of shootings and total victims, White Race and then Black Race is most affected. But there is majority of White people and then black people and then minorities in USA. So we cannot derive any inference.
Let's take this analysis further and let's compare the cause with the Mental Health Issues.
Let's visualize it for No of Shootings

Let's visualize it for Total Victims

We can see that No of casualities are more in case of the person has Mental Health Issues than the person not having Mental Health Issues. Unknown mental health state is a scary issue. There are many people with mental health issues due to abusive childhood, bullies, poisonous environment, job opportunities etc.

Above figure is not giving us the big picture in terms of comparison. So let's take it down to another comparable plot.

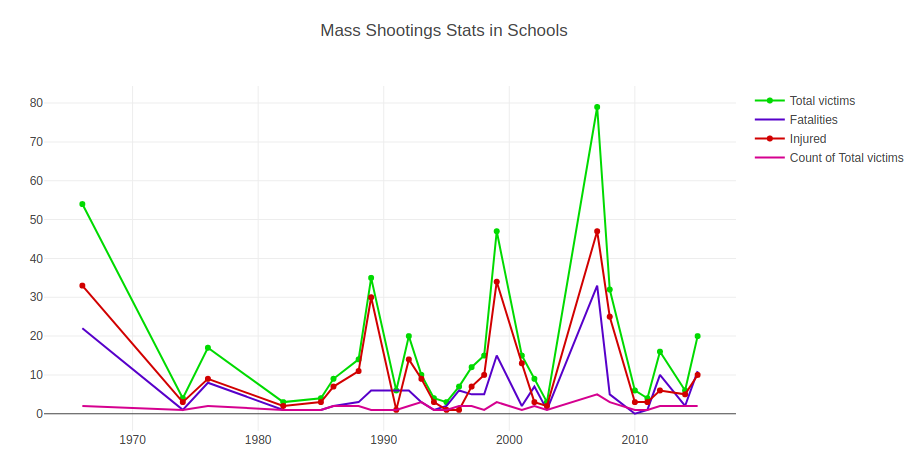
Let's break it down to Target audience by shooters in School Area.

As expected the target audience is School people and the random people there.So no new inference can be drawn.
- We can see that there is an increase in no of mass shootings between 1984-2000.After that the sudden increase in the no of mass shooting was seen in the year 2007 of Virginia Tech shooting. 2012 recorded highest no of casualities as compared to all previous years. 2015 and 2016 got a severe high no of shootings resulting in many more casualities. Although 2017 got less no of shootings but the victims were highest in that year till date. Main shooting in 2007 was Las Vegas strip concert mass shooting. It is only possible when there is an easy access to the guns to commom peple and its purchase is not controlled by the government
- There seems to be a big gap between identifying a person to be having mental health issue and really helping with the issue. Due to this problem it is highly unpredictable of person that he will shoot.abusive childhood, bullies, poisonous environment, job opportunities etc results in unpredictable mental status
- Limit the availability of guns in the market.
- For Mental health the society must maintain the good decorum among themselves which is quite impossible.