Invisible axes should have no size #706
Conversation
|
I may look at adding images as axis labels in #651, and there are other axis concerns in #701 (comment):
Looking forward to your feedback. |
Additional refactoring is still required (see TODO comment)

Discussion in ScottPlot#706 and ScottPlot#699
Rotated TicksHey @Benny121221, thanks for your work on this! I feel like you did all the hard work by figuring out where this error was and how to fix it, and I extended it slightly farther by adding support and a cookbook example for rotated ticks on the vertical left axis. I replaced your switch statement with this. What do you think? ScottPlot/src/ScottPlot/Renderable/Axis.cs Lines 377 to 390 in 3c19169 Multi-Axis Auto-Axis
I think a separate PR is the way to go. I'd love to merge this PR in, close #699, and release a NuGet package in the next day or two. Work related to multi-axis and auto-axis behavior has a tendency to explode into complexity, so if that happens it would be nice to have that work contained in its own PR in case it gets complicated. |
Additional refactoring is still required (see TODO comment)

Discussion in ScottPlot#706 and ScottPlot#699
Cool, I used cherry-pick to create a new PR with the same commits except for the axis collapsing stuff. You can see that PR in #708 |
|
Hey @Benny121221, thanks for cherry-picking #708! I'm happy that's merged in now.
I think I got confused by this text. It sounded like you were describing a bug in where plots with multiple axes aren't properly panned/zoomed or reset by middle-clicking. This is why I thought this PR might explode in complexity (because multi-axis auto-axis is a bit thorny). However, when I flip through the multi-axis cookbook demos things seem all right to me. Is the text above referring to undesired behavior just in the heatmap module, or something that causes undesired behavior for all plot types? If the latter, I might need clarification on what the issue is and how I can recreate it... |
|
The issue is any axis that isn't the primary one will not be reset by a middle-click. However zooming and panning will be reflected properly on all axes. |
|
On my system middle-click auto-axis works for multi-axis demos. I confirmed this on the WinForms, WPF, and Avalonia controls. I'm still a bit confused on what the issue is, and how it differs from what I observe here 🤔
|
|
@swharden I see where I went wrong, my second axis wasn't associated with any plottables, so it was never reset. It looks like the best way to give a heatmap arbitrary axes is to allow a plottable to hold 2 sets of axes, with independent tick labels. I don't know how helpful this is for other plottables, I suppose it could be used to have axes in two different units, i.e. one axis has distance in metres and the other in feet. Not sure if this is an option that should be put on all Now, there is another option, make heatmaps unpannable and unzoomable. I do wonder if panning/zooming really makes sense for heatmaps or pie or radar charts. They're not plottables that need to be zoomed or panned in and of themselves, and they are unlikely to share a plotting window with other plottables (not least because the user doesn't actually know the coordinates where they are drawn). I don't know what other libraries do with these sorts of plottables, and I think the flexibility of being able to zoom does mean that if something is covered by the legend the user can just zoom out instead of needing to fix it in their code. |
|
Awesome - it sounds like our misunderstanding is resolved, and thankfully the multi-axis / auto-axis system isn't broken! I'll go ahead and merge this PR, and I'm relieved it didn't "explode in complexity" after all. Similar to my sentiment in #666 (comment), I'll probably withhold engaging in heatmap discussion today, focus on getting a NuGet package published today, then hopefully we can aggregate all the various heatmap discussions into one somehow and focus on that exclusively for a bit. @Benny121221 I'm not sure how interested you are in exploring GitHub's features, but now that ScottPlot is an organization we have access to projects/tasks to organize progress on the heatmap front https://github.com/orgs/ScottPlot/projects ... I'm not sure if that would be helpful for organizing those efforts, or hurtful because it would further dilute the conversation with yet another location for it to occur in, but I thought I'd mention it in case you had an opinion about it or were interested in checking it out. |
|
@swharden I created a public project https://github.com/orgs/ScottPlot/projects/1 for heatmap features. I've used Azure's version which has issue tracking and kanban boards, it looks like githubs is more barebones (which is not necessarily a bad thing, Azure's version is very bloated). I think it's a decent enough way of planning things. |
New Contributors:
please review CONTRIBUTING.md
Purpose:
Makes two adjustments to the axis system:
New Functionality:
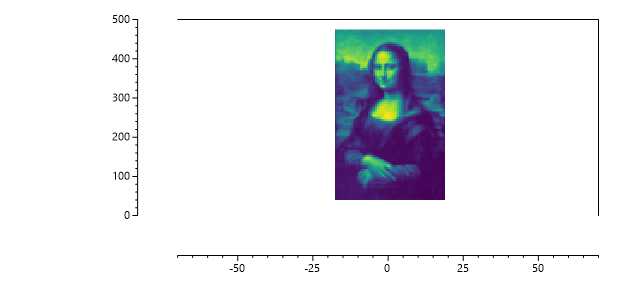
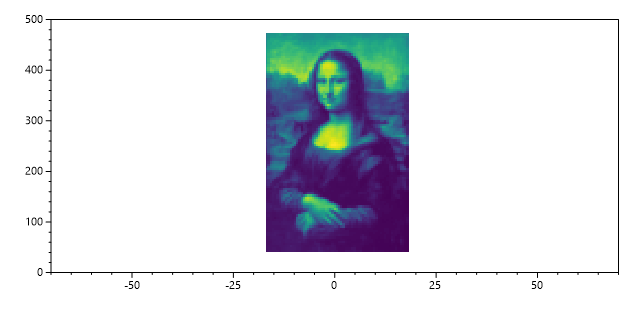
Collapsing Axes:
Before:
After:
Code:
Accommodating Large Numbers
Before:
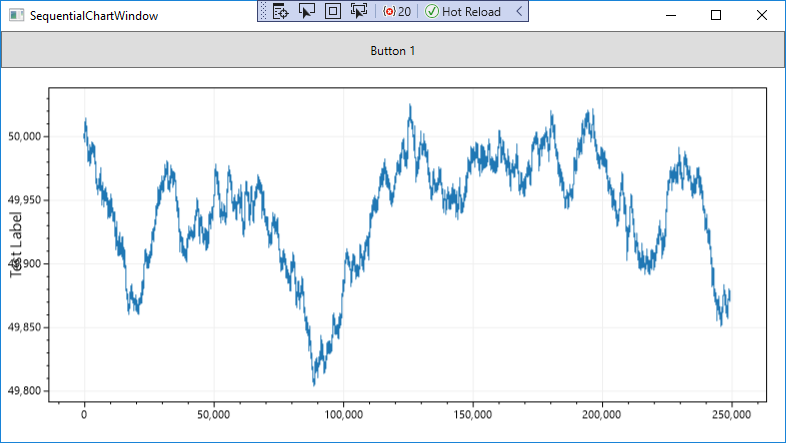
After:
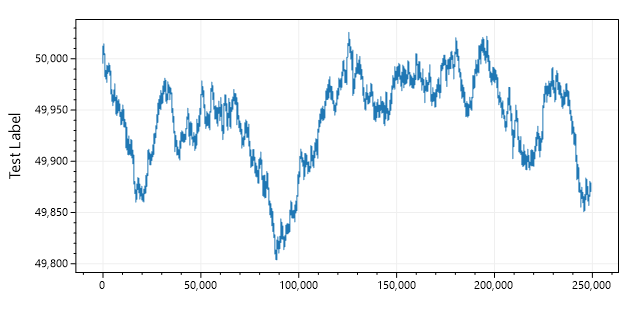
Code:
I normally would split these PRs into two, but I think because they're so conceptually similar and they're so small that it makes more sense to review them as one. However I can make two separate PRs if you would prefer.