
Albi, G., Gerbasi, A., Chiesa, M., Colombo, G.I., Bellazzi, R., Dagliati, A. (2023). A Topological Data Analysis Framework for Computational Phenotyping. In: Juarez, J.M., Marcos, M., Stiglic, G., Tucker, A. (eds) Artificial Intelligence in Medicine. AIME 2023. Lecture Notes in Computer Science(), vol 13897. Springer, Cham. https://doi.org/10.1007/978-3-031-34344-5_38
requirements.txtcontains the Python requirements for running the package.- A tabular dataset made of N rows (patients or sample), M features (clinical features), a binary class Y that define the initial clinical phenotype and an id column PATIENT_ID defining the samples id.
python pheTDA/TDA_Mapper.py --dataset_path "../data/dataset.xlsx" --binary_class "Y" --patient_id "PATIENT_ID" --seed 203 --test_set_split_proportion 0.3 --continue_features ["Age","BMI"] --list_lens_functions ["PCA","tSNE","UMAP"] --n_dimension_projection 2 --perplexities list( np.arange(15,55,10)) --learning_rates list( np.arange(300,1000,300)) --n_iters list(np.array([1500])) --min_dists list(np.array([0.25,0.5,0.75,0.9])) --n_neighbors list( np.array([5,10,25,50,120,150,200])) --resolution list( np.array([14, 16, 18, 20, 22])) --gain list( np.array([0.2, 0.3, 0.5, 0.6]))python pheTDA/Computational_phenotyping.py --trainingset_path "data/trainingset.npy" --testset_path "data/testgset.npy" --binary_class "Y" '--id_paz' "PATIENT_ID" --distance_matrix_path "data/trainingset_distance_matrix.npy" --n_dimension_projection 2 --seed 203 --projection_lens umap.UMAP(n_components =2 , random_state= 203, n_neighbors= 50, min_dist=0.9) --resolution 18 --gain 0.5 --colormap "coolwarm" --community_detection_algorithm "Greedy modularity" --list_of_classifiers ["logistic regression","random forest","XGBoost"] --cv_split 5-
clinical variables considered in
./CAD_paper_results/clinical_variables_list.txt -
Results from the first step of the grid search. For each row we report the lens functions, hyperparameters and their values, and the minimum graph entropy obtained for each lens. The score (in bold) indicates the optimal lens resulting from the first step of the grid search.
| Lens function (f) | Hyperparameters (θ’) | Grid search values | Graph entropy H(g) |
|---|---|---|---|
| PCA | - | - | - |
| t-SNE | learning rate perplexity |
[300, 600, 900] [15, 25, 35, 45] |
0.682 |
| UMAP | minimum distance n° of neighbours |
[0.25,0.5,0.75,0.9] [5,10,25,50,120,150,200] |
0.657 |
| UMAP autoencoder | first hidden layer size n° of hidden layers |
[3, 4] [200, 400] |
0.703 |
| UMAP encoder | hidden layers size n° of hidden layers |
[3, 5] [100, 200] |
0.713 |
- Results from the second step of the grid search. For each row we report the Mapper parameters, their relative hyperparameters and their values. Values in bold are chosen according to graph statistics.
| Mapper parameters θ | Hyperparameters (θ’) | Grid search values |
|---|---|---|
| Resolution (r) | - | [14, 16, 18, 20, 22] |
| Gain (g) | - | [0.2, 0.3, 0.5, 0.6] |
| Cluster method (C): | ||
| agglomerative complete-linkage spectral clustering DBSCAN |
n° of clusters (N) n° of clusters (N) epsilon minimum samples |
[2,3] [2,3] [0.2, 0.3, 0.5] [2, 4] |
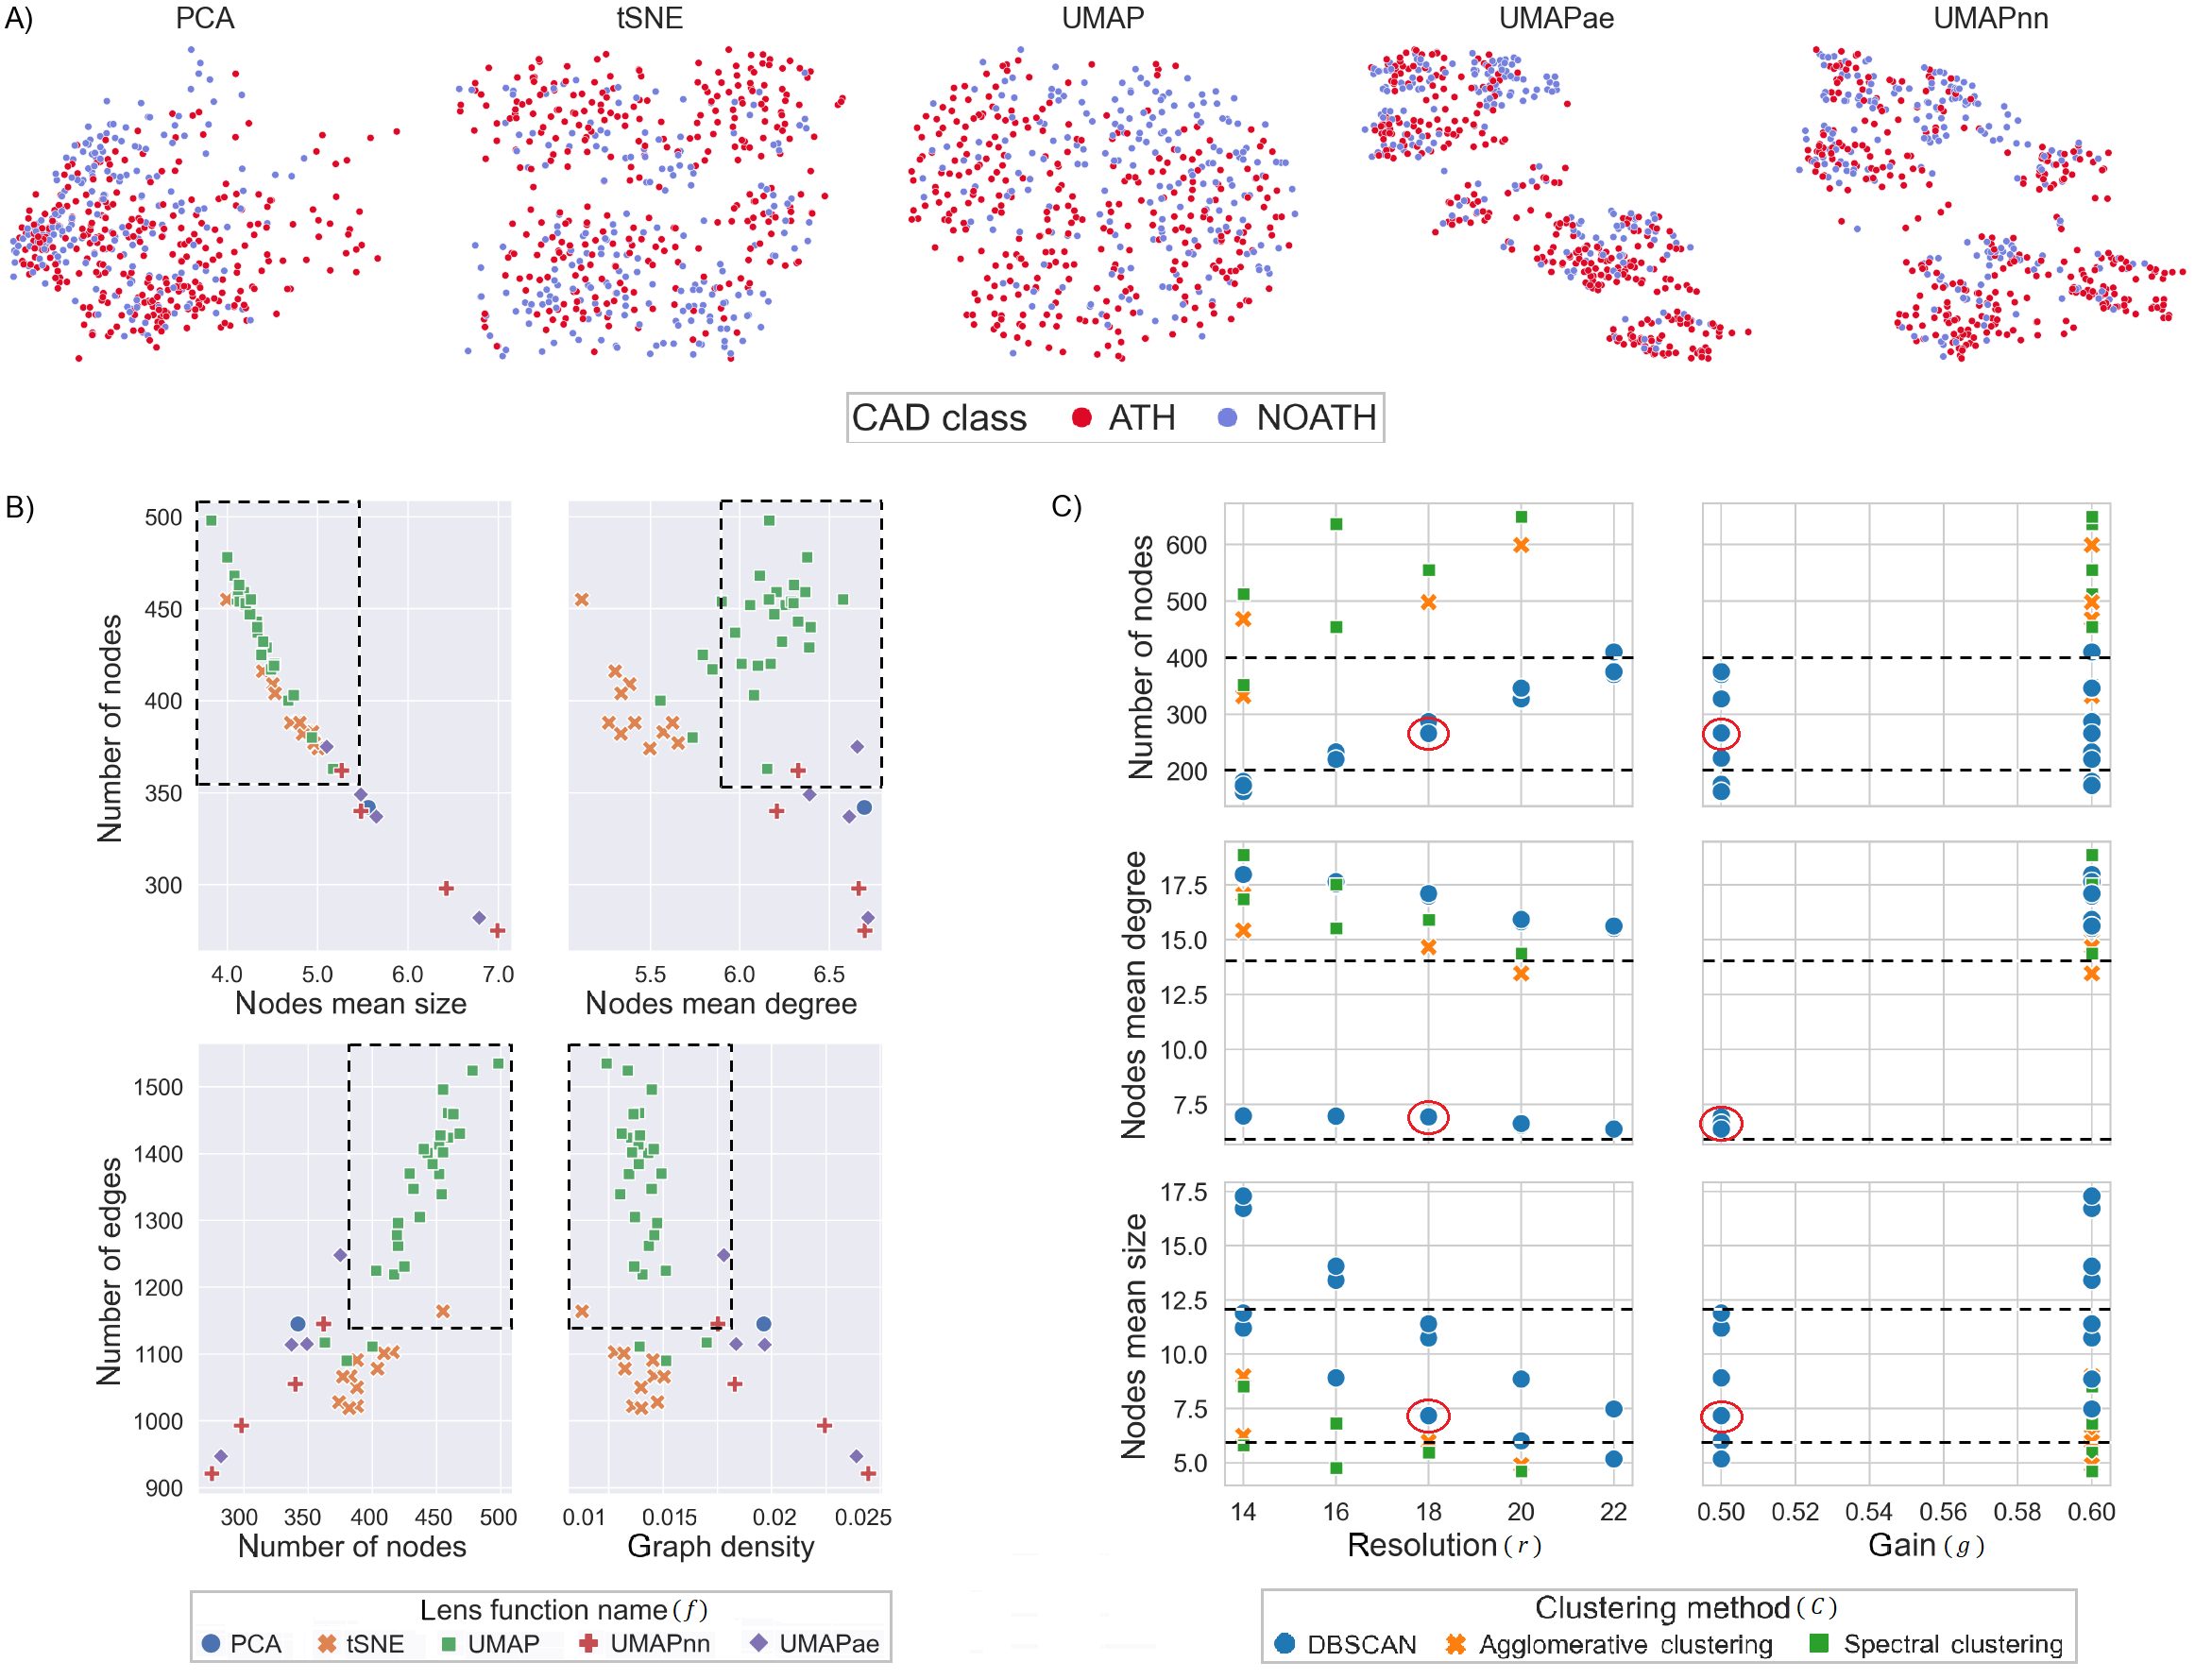
- Figure with the highlighted overall results of the grid search. A) Training set 2D projections for each lenses and B) the graph statistics plotted and highlighted for the second step.
- Results from the computational phenotyping. Classifier models trained using a one-vs-rest binary classification task to predict the patient’s membership to each subgroup. For each model we report the hyperparameters tuned, the range and the best score (mean and ± accuracy) obtained for each subgroup (in bold if the higher for the subgroup).
| Model | Hyperparameters and values | α' | β' | γ' | δ' | ε' |
|---|---|---|---|---|---|---|
| EN logistic regression | λ_1 = [0.25 0.5 0.75] λ_2 = [0.001 0.01, 0.1, 1, 10] |
0.76±0.08 | 0.93±0.03 | 0.99±0.01 | 0.93±0.02 | 0.96±0.02 |
| Random forest | maximum tree depth = [1, 3, 5] minimum samples to split = [2, 5, 10] minimum samples in a leaf = [1, 5] n° of estimators = [100, 200, 300] |
0.60±0.08 | 0.79±0.04 | 0.98±0.01 | 0.88±0.03 | 0.96±0.01 |
| XGBoost | gamma = [0, 0.1, 0.2, 0.3] learning rate = [0.1, 0.25, 0.5] maximum depth = [1, 3, 5] n° of estimators = [100, 200, 300] |
0.56±0.08 | 0.89±0.03 | 0.98±0.01 | 0.91±0.03 | 0.96±0.01 |