Data visualization issue #79
Assignees

Labels
bug
Something isn't working
Comments
|
Hi! It seems that I needed to input |
|
Just tested, it works great. Alberto |
|
No problem, thanks for the bug report! I'll keep this issue open to notify you when I draft a new release for 1.1.3, I am currently working on several compiler optimizations & the current continuous build may have issues. |
|
Hi, I just created a new release that fixes this issue and brings various improvements. I'll close this issue, feel free to open it again if problems re-appear. |
Sign up for free
to join this conversation on GitHub.
Already have an account?
Sign in to comment
Hello,
I found a new issue introduced with version 1.1.2 some data are visualized with wrong values, the values string is this
/*240,0,126,-127,64,0,1,-2,63,1,-2,63,0.00,0.00,0.00,1.00,254.00,63.00,0,0,0,0,0,0,0,0,0*/the json file is this
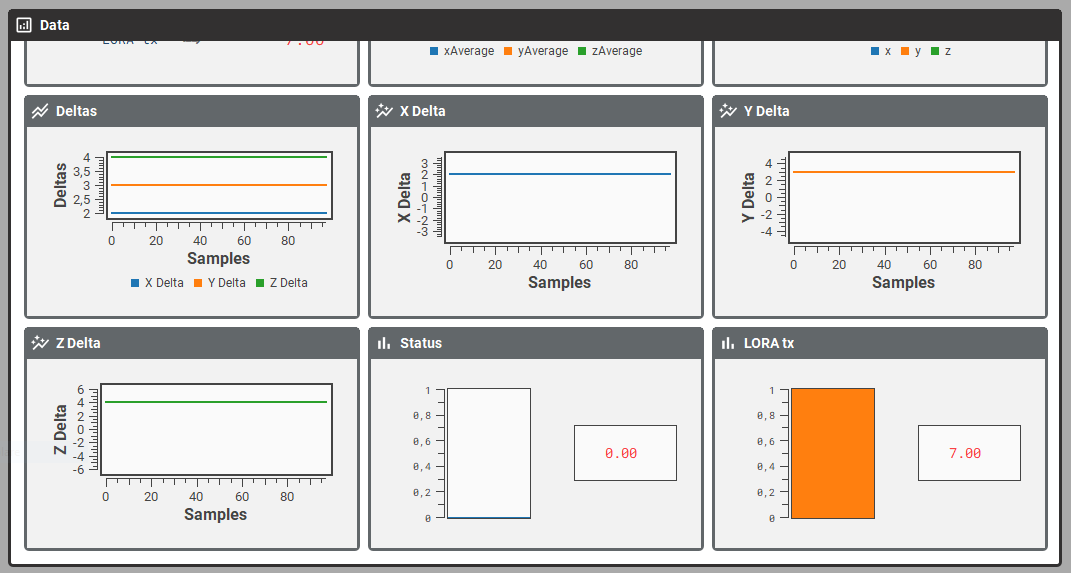
{ "fe": "", "fs": "", "g": [ { "d": [ { "alarm": 0, "fft": false, "fftSamples": 1, "g": false, "led": false, "log": false, "max": 100, "min": 0, "t": "Count", "u": "", "v": "%1", "w": "" }, { "alarm": 0, "fft": false, "fftSamples": 1, "g": false, "led": false, "log": false, "max": 1, "min": 0, "t": "Status", "u": "", "v": "%2", "w": "bar" }, { "alarm": 0, "fft": false, "fftSamples": 1024, "g": false, "led": false, "log": false, "max": 1, "min": 0, "t": "LORA tx", "u": "", "v": "%27", "w": "bar" } ], "t": "udpSS", "w": "" }, { "d": [ { "alarm": 0, "fft": false, "fftSamples": 1024, "g": false, "led": false, "log": false, "max": 0, "min": 0, "t": "xAverage", "u": "", "v": "%19", "w": "" }, { "alarm": 0, "fft": false, "fftSamples": 1024, "g": false, "led": false, "log": false, "max": 0, "min": 0, "t": "yAverage", "u": "", "v": "%20", "w": "" }, { "alarm": 0, "fft": false, "fftSamples": 1024, "g": false, "led": false, "log": false, "max": 0, "min": 0, "t": "zAverage", "u": "", "v": "%21", "w": "" } ], "t": "Averages", "w": "multiplot" }, { "d": [ { "alarm": 0, "fft": false, "fftSamples": 1024, "g": false, "led": false, "log": false, "max": 0, "min": 0, "t": "x", "u": "", "v": "%3", "w": "" }, { "alarm": 0, "fft": false, "fftSamples": 1024, "g": false, "led": false, "log": false, "max": 0, "min": 0, "t": "y", "u": "", "v": "%4", "w": "" }, { "alarm": 0, "fft": false, "fftSamples": 1024, "g": false, "led": false, "log": false, "max": 0, "min": 0, "t": "z", "u": "", "v": "%5", "w": "" } ], "t": "xyz", "w": "multiplot" }, { "d": [ { "alarm": 0, "fft": false, "fftSamples": 1024, "g": true, "led": false, "log": false, "max": 0, "min": 0, "t": "X Delta", "u": "", "v": "%22", "w": "" }, { "alarm": 0, "fft": false, "fftSamples": 1024, "g": true, "led": false, "log": false, "max": 0, "min": 0, "t": "Y Delta", "u": "", "v": "%23", "w": "" }, { "alarm": 0, "fft": false, "fftSamples": 1024, "g": true, "led": false, "log": false, "max": 0, "min": 0, "t": "Z Delta", "u": "", "v": "%24", "w": "" } ], "t": "Deltas", "w": "multiplot" } ], "s": "", "t": "Data" }and this the dashboard
The LORA tx value on the string is 0 but the visualized value is 7
Many thanks.
Alberto
The text was updated successfully, but these errors were encountered: