Welcome! Contained here is the shell project for the full stack developer interview. Don't stress and lets crush some code.
We aren't fans of whiteboard interviews or synthetic toy problems to assess if someone will be a good fit on an engineering team. Instead we think your interview should mirror what your typical day to day will actually be so that we can all get an accurate picture of what working together will be like.
The goal of this is to grab some data off the Internet, insert it into a sqlite, run some analytics, and get those numbers to show up on a HTML page. The shell project here is nodejs based but feel free to use any language you're comfortable with.
If you chose to use a different language, you'll just need a sqlite driver and a HTTP server to serve back the index.html file.
- Definitely don't spend more than 3-4 hours on this
- Read this whole document before you start so you can quarterback things out
- Don't add any libraries to the source files
- Using StackOverflow is fine but don't blindly copy/paste code
Download 3 recent BlueBikes data files from https://s3.amazonaws.com/hubway-data/index.html into the "data/" folder.
- https://s3.amazonaws.com/hubway-data/201906-bluebikes-tripdata.zip
- https://s3.amazonaws.com/hubway-data/201905-bluebikes-tripdata.zip
- https://s3.amazonaws.com/hubway-data/201904-bluebikes-tripdata.zip
First, copy "bluebikes.db" into the "db/" folder.
"bluebikes.db" is a sqlite database containing a single table named "trip". The structure of the table is:
CREATE TABLE `trip` (
    `id`	INTEGER NOT NULL PRIMARY KEY AUTOINCREMENT,
    `tripduration`	INTEGER,
    `starttime`	TEXT,
    `stoptime`	TEXT,
    `start_station_id`	INTEGER,
    `start_station_name`	TEXT,
    `start_station_latitude`	TEXT,
    `start_station_longitude`	TEXT,
    `end_station_id`	INTEGER,
    `end_station_name`	TEXT,
    `end_station_latitude`	TEXT,
    `end_station_longitude`	TEXT,
    `bikeid` INTEGER,
    `usertype` TEXT,
    `birth_year` INTEGER,
    `gender` INTEGER
)
The names of the columns map to the headers in the BlueBikes files except spaces have been replaced with underscores ("_").
The project shell is setup to look at the first CLI argument and either seed the database or start the server.
$ node index.js seed
Will connect to the database and run this.insertFiles. Feel free to implement this any way you want.
The getData() function has the JSON structure for the statistics you need to calculate from the trip data. The properties are:
medianTripTime: The median value of the tripduration column.
mostPopularRoute: The most popular (start_station_name, end_station_name) combination.
avgBirthYear: The average value of the birth_year column.
percentByDay: Calculate the percent of trips per day. Ex. (# of trips on Monday)/(# of total trips)
The final step is getting the data from getData() to show up in index.html. You can start the server with:
$ node index.js server
And then load http://127.0.0.1:8080 to view web/index.html
The goal is to get the data to appear so that it appears the same way as "mockup.png".
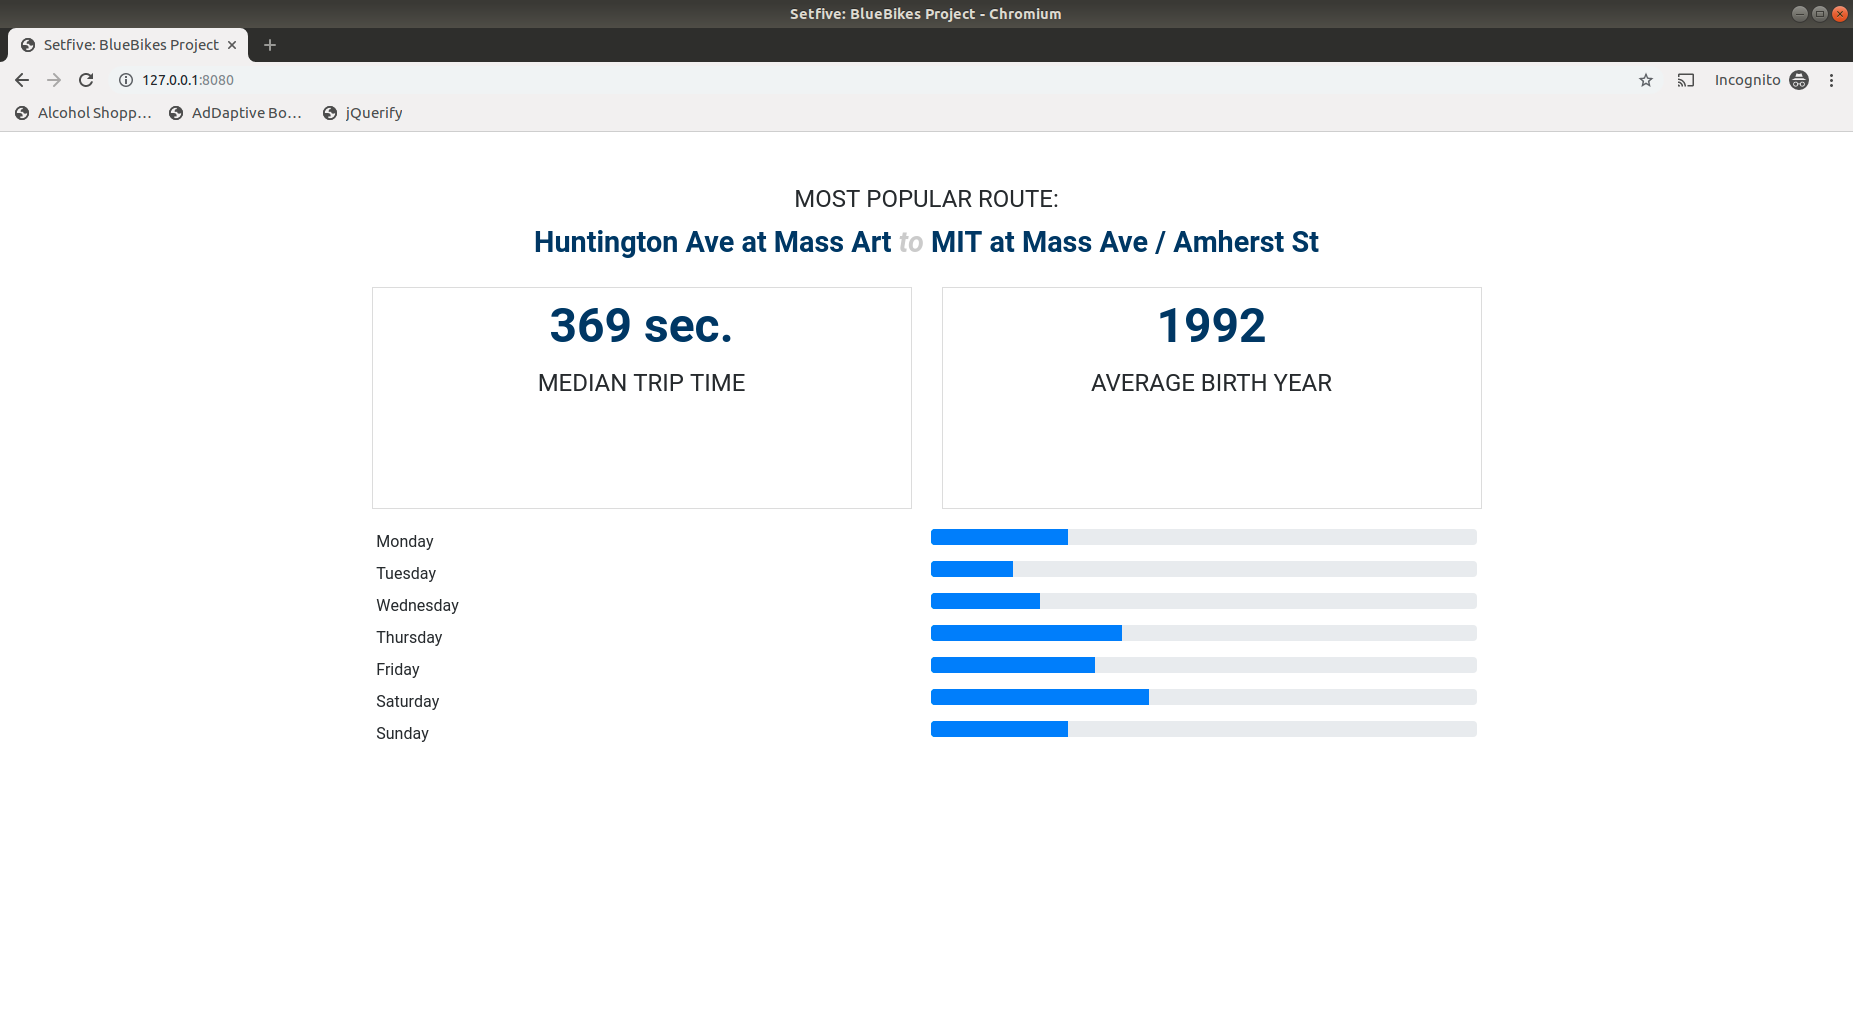
The numbers in the mockup aren't accurate but the layout reflects what we're looking for.
Once you're done, ZIP or TAR up this folder, post the archive on a file sharing service like Google Drive and email contact@setfive.com a public link to your files.
Have a question or run into an issue? Just email contact@setfive.com