Predicting March Madness games with machine learning. This is inspired by the Kaggle March Mania competition. Our data is sourced from this competition.
Our Google Slides presentation will address relevant deliverables not accomplished in this ReadMe.
We are going to use a group of college basketball datasets to predict which team is most likely to win in a head to head match in the March Madness competition. We'll compare features such as historic rankings and average points, rebounds, and turnovers per game to predict this probability.
Our project roadmap is maintained in Google Slides.
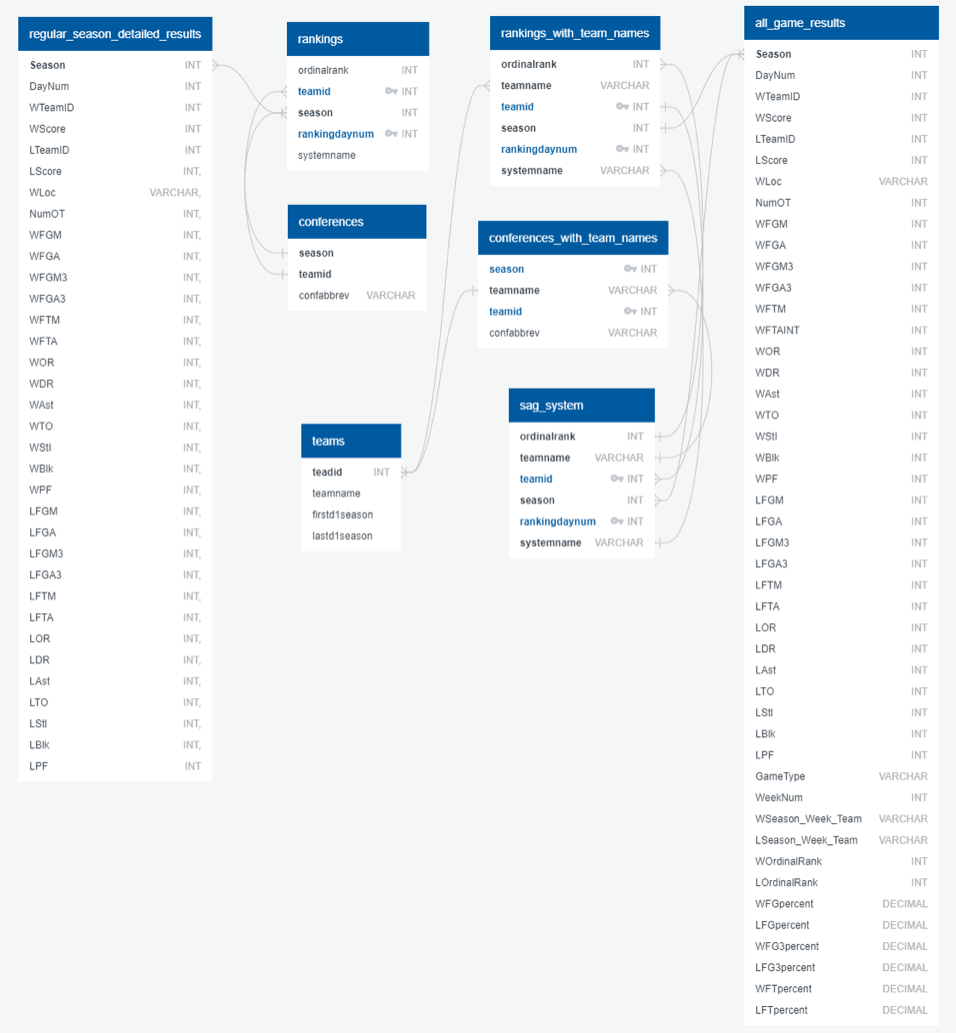
Our database will consist of the following tables: Teams, Team_Rankings, Compact Results (both Regular season and tourney versions) and Detailed Regular Season Results (both regular season and tourney versions). The database will be hosted through AWS's RDS. The current ERD is shown below.
Our model is a random forest algorithm that produces the probability that Team A will win against Team B for all possible 2,278 March Madness games.
Our features include in-game basketball statistics (shooting percentage, rebounds, turnovers, etc.) and poll rankings that pertain to both the Winner and Loser of a game. We use detailed box score results from historic games during the 2003 season onward to train and test the model. The model will determine feature importance and produce probability that a given team (Team A) will beat another given team (Team B).
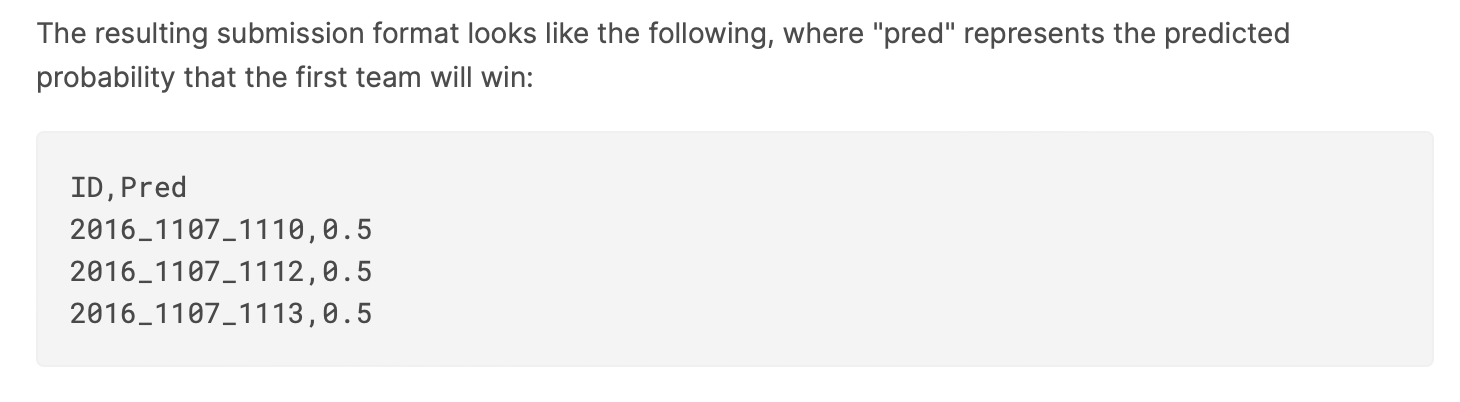
The raw output will be formatted as below.
Features will be discussed in more detail in the next section but a random forest was chosen because we are ultimately trying to predict a binary, labeled outcome and have multiple features with an unkown (to us) importance. We want to avoid overfitting, understand our features' importances for communicability, and handle large datasets. While a random forest may not be the best model for accuracy in this situation, it is the best balance of executabiliy, accuracy, and understanding.

Fortunately, the Kaggle data comes precleaned. However, to ready our data for random forest classification a few preprocessing steps were taken.
- Dropped all results before 2003 season to enable us to pull in rankings for each game
- Created columns for Season-Day-Team to enable use as a primary key in our database, if needed in the future.
- Merging rankings into our box score dataframe, so the winner and loser each have their rank from that week of the season
Next, we engineered our features. Feature selection was influenced by the Four Factors popularized by Dean Oliver. The logic is that basketball is obviously a game of scoring more points than your opponent. To accomplish this obvious goal, teams want to score efficiently on their possessions, get more possessions than their opponent, and end possessions with scoring attempts vs. turnovers. In addition to in-game stats, we added Rankings as well, to synthetically and indirectly account for strength of schedule.
One notable omission at this current stage is if the game was played as a Home, Away, or Neutral game for the winning team. This was done for simplicity of the model at this time.
Current features (formatted as the differential between winner and loser): Rankings, effective FG percentage (a measure of shot efficiency), FT percentage, Offensive and Defensive Rebounds, Assists, Turnovers, Steals, Blocks, and Personal Fouls.
Feature importance below:

Our model was then trained and tested using scikit-learn's train_test_split method on regular season data. This was done because there is over 100,000 regular season games to work with, vs little over 2000 tournament games. We will use the regular season trained model to predict the tournament games.
The model features are formatted as differentials because we will use season averages for teams in the tournament, then take the stat differentials between a given pair of teams, and predict the outcome with our model.
Our model has a test accuracy score of 62% on the original test data.

This accuracy score deteriorates when predicting on this year's tourney games, being much closer to 50%. The primary reason is the model is trained on the margin of different stats in the form of: Winner_Stat - Loser_Stat = stat_diff. When predicting the tournament games, we do not have labeled outcomes, so the Stat_diff becomes much more random since it takes the form of: lower_id_team_stat - higher_id_team_stat = stat_diff. As a result, the current model is little better than a coin flip at ~51% accuracy.

As we dig into the confusion matrix we see how we arrived at our Accuracy Score, given the tests formulated to roughly a 33%. Reviewing the other calculations from the confusion matrix we find: our senstivity is roughly 64% and our precision being just about the same at 63%. Ultimately our F1 score calculated out to about .63 which is decent score to bring towards the rest of our test. Ultimately we believe that updates to our machine learning model will assist in improving our accuracy scroe, while hopefully retaining consistent scores from our other performance indicators.
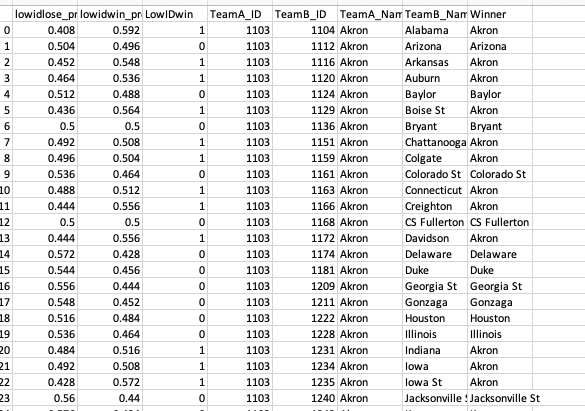
To fix this, we can retrain the model on high_id - low_id margins and low_id - high_id margins and take the average of the two models. We would then be accounting for randomness on both sides. Due to time constraints and the need to essentially double our training and testing, we will be proceeding with the model as is for our presentation, despite its shortcomings. We feel confident that, should we have another week to work on this, we could alleviate this flaw. Shown below is our final prediction output. Note probabilities are in a tight range from 40% to 60% on either side of a given matchup.
We will use a variety of tools, including Tableau, to make an interactive head to head matchup predictor for users. We will also show a variety of Exploratory Data Analysis (EDA) visuals to tell the story of the nation's greatest tournament!
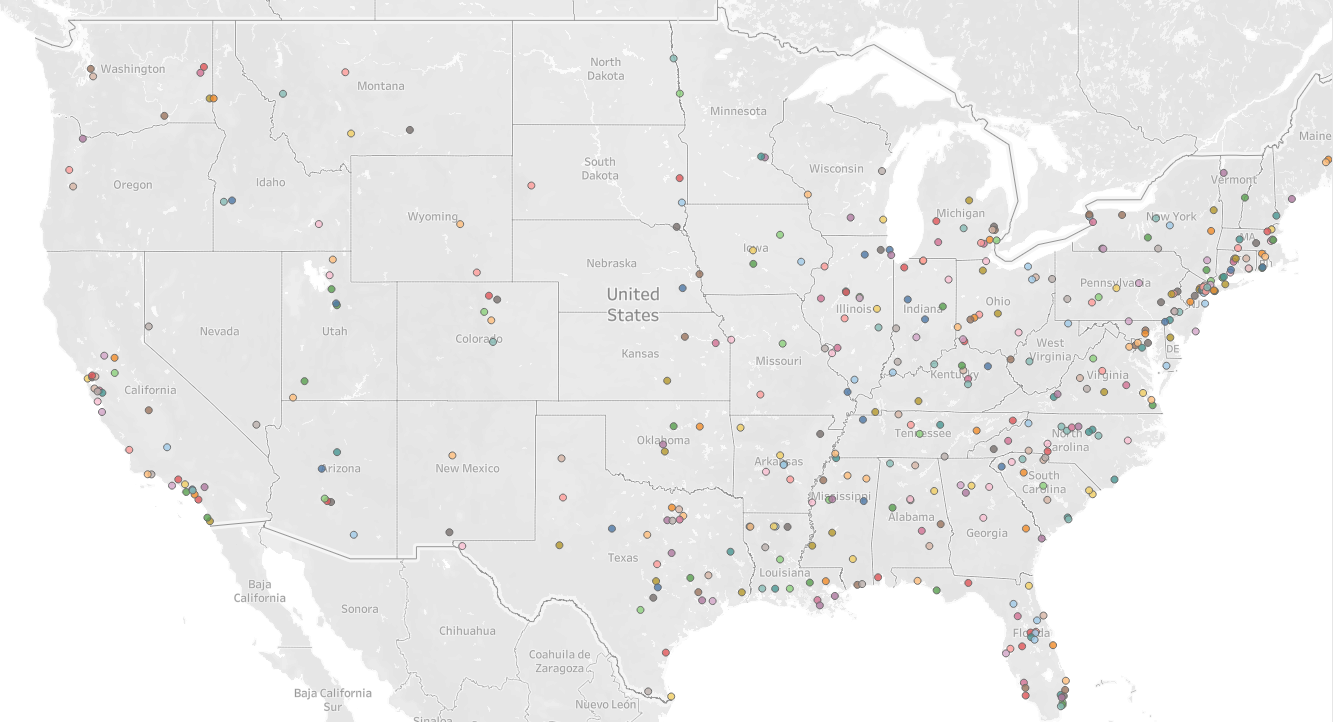
This Tableau Story houses our current visualizations. One example below is a map of all D1 Schools with Men's Basketball Programs.