Memory leak when using metrics #1321
Comments
|
I meet the same problem. |
|
@bai There is a real issue with go-metrics and Sarama use of it. My old colleagues also reported the same issue. What are our options here? |
|
If you'd ask me, I don't find Sarama's metrics useful and have no production workloads that rely on it in any way, preferring prometheus or custom integrations instead. Also, go-metrics seems abandoned (or on life support, depending on what your threshold of "abandoned" is) with last commit made in October last year. In fact, it seems that you already raised this issue a month ago. Do you happen to have any data on usage of Sarama's metrics? |
|
Yeah, I also think that we should announce and remove this functionality. It is maintenance nightmare and not very good. How do we do that @bai? As far as usage, I was trying to get some broker/consumer related metrics from sarama, but they are not good at all. You get an amalgamation bunch metric type and then you have to turn them into their particular metric type(count, gauge etc) on call site. So more unnecessary complexity. |
|
I have historically managed to completely avoid breaking changes to the API (thus the fact we're still on v1 with semantic versioning). If this is worth ripping out, then perhaps it's finally time for a v2, and we can roll in a bunch of the things I'd collected in https://github.com/Shopify/sarama/wiki/Ideas-that-will-break-backwards-compatibility at the same time? |
|
I agree. |
|
Will be nice if will be a way to disable the metrics from sarama configuration. Meanwhile resolved this problem by writing mine metrics registry. Because default one is keeping all metrics in memory. Solution is to have a empty one: var (
EMPTY = make(map[string]map[string]interface{})
)
type EmptyRegistry struct {
}
func NewEmptyRegistry() metrics.Registry {
return &EmptyRegistry{}
}
func (r *EmptyRegistry) Each(f func(string, interface{})) {
}
func (r *EmptyRegistry) Get(name string) interface{} {
return metrics.NilMeter{}
}
func (r *EmptyRegistry) GetOrRegister(name string, i interface{}) interface{} {
str := fmt.Sprintf("%s", i)
if strings.Contains(str, "metrics.Meter") {
return metrics.NilMeter{}
}
if strings.Contains(str, "metrics.Histogram") {
return metrics.NilHistogram{}
}
if strings.Contains(str, "metrics.Counter") {
return metrics.NilCounter{}
}
if strings.Contains(str, "metrics.Gauge") {
return metrics.NilGauge{}
}
if strings.Contains(str, "metrics.GaugeFloat64") {
return metrics.NilGaugeFloat64{}
}
if strings.Contains(str, "metrics.EWMA") {
return metrics.NilEWMA{}
}
if strings.Contains(str, "metrics.Healthcheck") {
return metrics.NilHealthcheck{}
}
return metrics.NilMeter{}
}
func (r *EmptyRegistry) Register(name string, i interface{}) error {
return nil
}
func (r *EmptyRegistry) RunHealthchecks() {
} |
|
I met this trouble too. I am using the latest version package.
my code : func consumer(broker, topic string) { |
|
@ToughK Are you also seeing the issue with using metrics from Sarama or without it? |
Using metrics from Sarama. There is no memory leak problem when not using metrics. |
|
Yeah, it's a known problem, it's because the library used to expose these metrics keeps the metrics in memory. |
|
wondering if we could introduce something like this: #1321 (comment) without breaking the API, and tell people the feature was removed? |
|
If you do not care about metrics, you can disable them as documented here (this was referenced by @thomas-mangin but probably not that easy to find): If you do care about metrics (probaby does not make much sense if saramaConfig := sarama.NewConfig()
saramaConfig.Producer.Return.Successes = true // Required for SyncProducer
producer, err := sarama.NewSyncProducer(endpoints, saramaConfig)
defer producer.Close()
...
producer, err := sarama.NewSyncProducer(endpoints, saramaConfig)
defer producer.Close()Or you can unregister the "cluster" metrics once you are done with, the "broker" metrics are unregistered on defer producer.Close()
defer saramaConfig.MetricRegistry.UnregisterAll()To be precise only the "cluster" meters (e.g. That being said reusing an |
|
Thank you for taking the time to raise this issue. However, it has not had any activity on it in the past 90 days and will be closed in 30 days if no updates occur. |
Versions
Sarama Version: 1.20.1 release
Kafka Version: N/A
Go Version: 1.12.1
using Sarama commit 03a43f9
Problem Description
Using Sarama to test the "liveliness" of a Kafka server, and calling
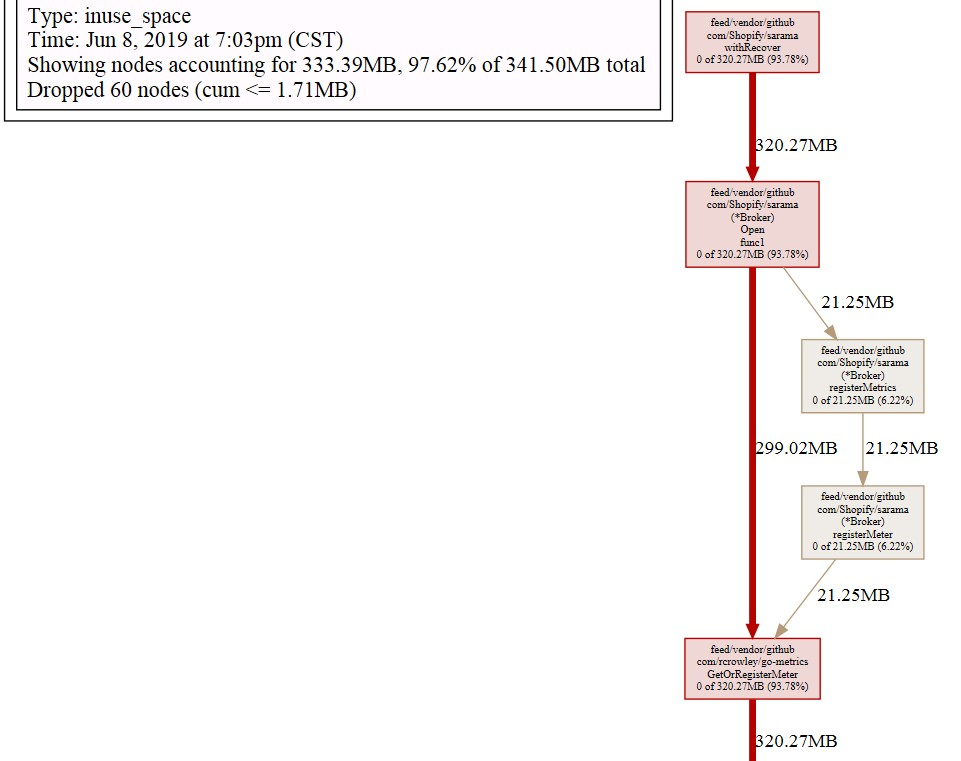
NewSyncProducerin a new goroutine every second, it was noted that the application was slowly leaking memory.Looking at the memory profiler, the memory was allocated by "go-metrics". The go-metrics commit used was 3113b8401b8a98917cde58f8bbd42a1b1c03b1fd
This issue was discussed in #897 and marked as resolved but it may not be the case.
The issue was noted when:
nilas configuration withNewSyncProducerNewConfig()when callingNewSyncProducerThe code which triggered the issue looked like
A work around was to reuse Sarama configuration objects when re-connecting to the same destination (I only noticed the option to disable metrics when looking to report this issue).
The text was updated successfully, but these errors were encountered: