![]()

This project is the implementation of a website for the exam of Scientific and Large Data Visualization, at the University of Pisa (a.y. 2021/2022). The website contains different data visualization made with D3js to analyze and compare different streaming platforms: Netflix, Prime Video and Disney+.
The project is divided in tow folders: public contains the index of the site which uploads the main js App stored in src which is the main directory. src contains the following files:
App.js- The main file of the project, where the site is built.index.js- It generates the root of the site.css- It contains the css files of the site.img- It contains the images of the site.Header- It contains the header of the site. It subdivided in:Logo- The visualization of the title of the site for desktop and mobile.Menu- Different menu options of the site for desktop and mobile.Dialog- It contains the dialog of the site with description of the project.Header.js- The main file of the header, where the header is built.
Footer- It contains the footer of the site.Dashboard- It is the main part of the site where data visualizations are made. In it there are:Dashboard.js- The main file of the dashboard, where the dashboard is built.VisualizationComponents- It contains the different visualization components of the dashboard.
Theme- It contains the light and dark theme of the site.data- It contains the dataset used for the visualization.notebooks- It contains the notebooks used to preprocess and integrate the data.GAEvent.js- It is the component to produce Google Analytics events.
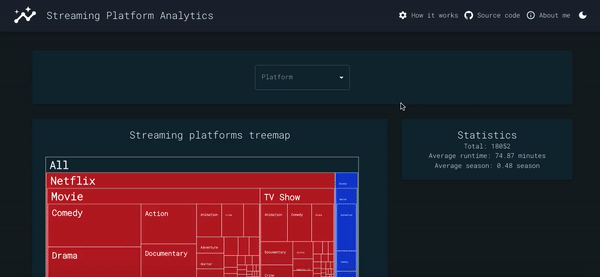
A list of movies and tv show from each platform for this project was taken from Kaggle (Netflix, Prime Video, Disney+). Then this list was completed using OMDb API taking more informations like actors, genre, runtime and ratings from IMDb, RottenTomatoes and Metacritic. Data relating to quarterly revenues and number of subscribers were collected from the respective financial site of each platform (Netflix, Prime Video, Disney+).
This is an example on how to run the project locally.
Install Node.js and npm. You can follow the instructions here.
- Clone the repository.:
git clone https://github.com/Simoniuss/streaming-platforms-analytics.git - Install the npm packages:
npm install - Run the project:
You can reach the site at
npm startlocalhost:3000.
I you want to make your own site and upload it o Github Pages you can just upload the folder to your own repository, setting the site following the instructions here. The GitHub action is ready, you just have to setup the homepage in package.json and create a new GitHub secret in your repository (GH Secret) with this name ACTIONS_DEPLOY_ACCESS_TOKEN.
Every time you push your code to GitHub, the site will be updated.
Distributed under the MIT License. See LICENSE for more information.