A proper well structured documentation for getting started with chrome pwning & v8 pwning
How this doc is organised
- Motivation
- Actual Study Material
Browsers are one of today’s most used pieces of technology. On every off the shelf computer, if we just plug and play we will see a browser installed. That’s why from an attacker’s perspective and a threat model perspective it’s very rewaradable if the attacker is able to compromise the browser through a malicious page. Given the upper arguments I choose to study Google’s Javascript Engine, particularly v8.
Given the gigantic nature of v8’s project,I choose as a starting point the interpreter, namely d8.Although extensive research has been done already on d8, we hope to at least find one bug and if not be able to move forward with research on browser exploitation since v8 provides entry ground for the basic exploit development strategies used on browser exploitation .
Another reason why I choose v8 as a target is that it’s used across multiple browsers.
If we look under the hood we can see that the engine is used in MicrosoftEdge too, so there is a multiple bug bounty award chance. For the underlying operating system the researcher will be using a mix of windows and linux since there’s no restriction in terms of obtaining a shell since v8 bugs allow code execution through wasm pages and it’s not bound to any platform specific.
Unfortunately, while an exploited bug in v8 would result in code execution, we won’t be able to execute any code due to the sandbox, and as such we would get code execution in the context of the renderer,which would not allow us to execute code on the machine. For that we would need another exploit for the sandbox,thus we would need a full chain in order to exploit the system.
And such we define the following goals in order to be able to get started with browser hacking
- Learn,map,master the internal structures used by V8 engine and the key points of Chrome architecture
- Learn and master the basics procedures necessary for browser exploitation
Learn,map,master the internal structures used by V8 engine and the key points of Chrome architecture
At the first stage of the project it's necessary to gather as much knowledge regarding Chrome Architecture and how each componenet interact with each other. In order to better understand this we need to the Chromium Project into multiple subcomponenets such that we are able to isolate everything and analyse it properly. More precisely in how many subcomponents each of the following components breaks
- V8 Architecture
- Chromium Architecture
- Blink Architecture
Now the most logical step for a first step is understanding chromium architecture. So ok we want to exploit the browser, but what happends when we first start the browser? Well after clicking the chromium executable , the executable starts some processes.
The order and their name is as follows:
First one is called content process. What does this process do ?
- It is know as the startup process.
- it is also the main process
- it's responsable for starting the actuall main process which is called browser process
Now that we briefly know what it does it is time to go more indepth on it:
-
So the way Chromium works on Windows at least, is that it compiles the files into a dll , and after that it loads it into memory. So the core logic of Chroium browser is in chromium.dll.
This is also confirmed by the code
 .
.
This is take fromchrome_exe_main_win.ccand if u are currious to read the whole code it's located atchromium/src/chrome/app. Ok, going down with the execution we can see it callsMakeMainDllLoader()to call the dll loaded class after that it launches the "loader" aka it loads thechrome.dlland if it is necessary restarts it with the necessary command lines. To further analyse the Loader we need to understand it's code, which in the same directory, in the filemail_dll_loader_win.cc.Scrolling all the way down of the file we can see the call toMakeMainDllLoaderwhich in terms calls based on the verion you haveChromeDllLoaderorChromiumDllLoader.

We can see thatChromiumDllLoaderis a class which inherites fromMainDllLoader. We can see from the definition that the class simply does is to load the dll based on the arguments passed to cmdline and process type
 .
.
Analysing the Launch method we can understand some things that happen before chrome.dll starts: We can understand from this comment that "// Launching is a matter of loading the right dll and calling the entry point. // Derived classes can add custom code in the OnBeforeLaunch callback." launching chrome is a matter of loading a bunch of dll which actually do the work. Secondly it takes the arguments passed to command line and further it initialises the sandbox services.
 .
.
First it checks to see if it's the browser who's calling the sandbox initialisation than it checks if the process which called the initialisation of the sandbox was called as a cloud print service. It also checks if--no-sandboxwas passed to the binary,which basically tells to the binary not to run in a sandbox. it checks if wether any of these were set and if either is true it calls the sanbox with the respective options. than in the end we get to

which is what we are interested in, this representing the wrapper to callingchrome_main. -
Now lets see what it does. we open chromium.dll in binja Based on this picture from https://blogs.igalia.com/jaragunde/files/2019/03/chrome-init-sequence.png we have a rough ideea of what should we look after in binja
This is how the graph looks in binja
 .
.
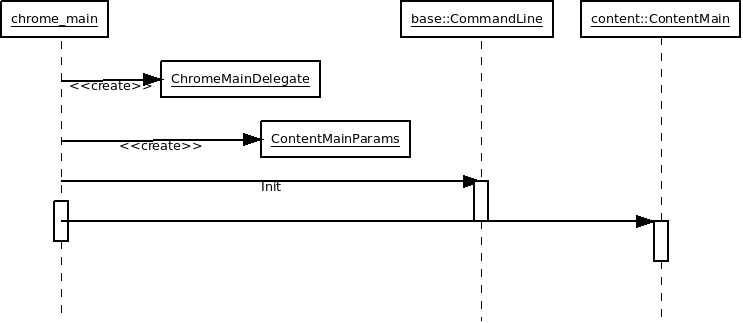
To be able to better track it down look for a function called ChromeMain. This is chrome's main(aka core) logic.Inside of it we can see the afro-mention phases of how chrome.dll runs at startup:
Here we can see the first it calls some functions such assub_180001420,sub_180017020,sub_180017020which do some checking to see some details regarding how chrome was installed/compiled. Using the source code we can track their atributes. First function,sub_180001420corresponds to UmaHistogramEnumeration,next we havesub_180017020which is InitializeFromPrimaryModule and third and last onesub_180017020is chrome_main_delegate.
We keep repeating chrome_main_delegate but we never defined what it's purpuse is. ChromeMainDelegate is a class which inherits from ContentMainDelegate and mainly provides startup related functions and process call processing. !In case you want you can implement a custom ContentMainDelegate interface to change the default behavior of the Content module, and use a custom ChromeMainDelegate class in Chromium to customize the behavior of the startup process.

Inside of it there are some function calls which do some xor on some data regions andconcat it with some regitry to get some options regarding chrome startup
 .
.
Also note that function sub_180001510 is creating a scopted pointer reference with two callbacks.Not really important thing that it does but it's interesting to learn what a BindStateBase is. We will meet it a lot in the chrome's basecode. Now you may be wondering what do the last three lines, precisly
 do. so first line basically creates a
 std::unique_ptr<>for Closures. WTF is a closure!? well if it were to cyte from mozila dev" closure is the combination of a function bundled together (enclosed) with references to its surrounding state (the lexical environment). In other words, a closure gives you access to an outer function’s scope from an inner function. In JavaScript, closures are created every time a function is created, at function creation time." It if were to use human language it's a function whiting a function which acceses a variable withing the outher function. Eg .
.
So in essnce it makes shure that the closure will execute. and the other two lines just set some specific behavior for dumps when chromecrashes.InstallDetails::Get().VersionMismatch()patchuie aici Going futher it checks for it's version at runtime and in case it doesn't match it it crashes and we arrive at the command line parsing
Stepping inside sub_184171800 we can see it is not that big First it takes the arguments passed to the current process, than calls a function which takes a StringPiece basically a class wrapper for std::string but a little bit cooler and that function basically checks if the binary was called headless,compares is the name of the binary which was run is chrome , checks if USE_HEADLESS_CHROME is set and than goes further into next step which is content main.
Based on the arguments provided , content main's job is to start the respective shell.
Now in case we don't provide any arguments to the shell the execution flow goes to .
.
In order to understand what it does we need to verify to source of it. We can find it at/src/content/app/content_main.cc
We will have to scroll all the way to the bottom and and there we will find the definition of the ContentMain function. There we see it calls two functions. One which initialises a ContentMainRunner which is the class that handles all the "process creation" in the context of creating the browser ipc sqli net and the rest. And the other one which basically check the type of subprocesses and feed it to the ContentMainRunner class.
Now let's take a step back in order to understand the codeflow. First let's examine the RunContentProcess as ContentMainRunner is quite complex.First step it does is to create a GlobalActivityTracker. Omg !!! you guess it google tracks you :))) Nah just kidding pls don't sue me Google. But on a serious note this track each thread which is a thread tracker and it does a couple of cute things for better debugging such as: which in essence means that there will be a unique integer used as an identifier for each thread to better understand what cause the process to break.
eg:
  kTypeIdActivityTracker = 0x5D7381AF + 4,   // SHA1(ActivityTracker) v4
  kTypeIdUserDataRecord = 0x615EDDD7 + 3,    // SHA1(UserDataRecord) v3
  kTypeIdGlobalLogMessage = 0x4CF434F9 + 1,  // SHA1(GlobalLogMessage) v1
  kTypeIdProcessDataRecord = kTypeIdUserDataRecord + 0x100,
tracking a process life stage which is defined as
// The phases are generic and may have meaning to the tracker.
PROCESS_PHASE_UNKNOWN = 0,
PROCESS_LAUNCHED = 1,
PROCESS_LAUNCH_FAILED = 2,
PROCESS_EXITED_CLEANLY = 10,
PROCESS_EXITED_WITH_CODE = 11,
// Add here whatever is useful for analysis.
PROCESS_SHUTDOWN_STARTED = 100,
PROCESS_MAIN_LOOP_STARTED = 101,
log asap when a process exits,save the information regarding the module aka when when a module(aka a componenet of chromium) is loaded and basically the same functinolity repeated but different for different threads and classes. In case you are interested you can find it at chromium/src/base/debug/activity_tracker.h
Afterwards checks if "Main()" was called before. Here i think they mean if the ChromeMain() was called before. They basically check if there were passed any command to the content process was called with any arguments.And in case it was , they make sure the browser process will get the same args.They than check for platform specific and in case windows is found the initialise they own handler by doing CreateATLModuleIfNeeded, than it's the same story checking for platform specifics and and they pass the arguments using SetupCRT and we get to the part where we initialise the ipc so we can talk to the other processes after we have spawned them. Here is the code responsabile for that. We won't go into details about it , as we will come back later discussing more indepth about the ipc mechanism of chrome. Just know this for the moment, this is the mechanism which facilitate the talking between the mutli architecture processes of chrome. And in case you don't know for what stands IPC, it's for inter process communication.
 .
.
Than what it does it "fordwards" rather more than sets the arguments for ui using ui::RegisterPathProvider, call the tracker and gets the result using content_main_runner->Initialize(std::move(params)) ,create a parent cosole, which i guess what they mean is that they create a parent process does some more checking and than we get to the important part which is  .
.
Here we see a call to a function called IsSubprocess.  what it does basically to avoid the old boilderplate code it checks in one function the type of the process it receives on command line and in case an option was passed it chooses from the following it creates the respective process.
return type == switches::kGpuProcess ||
type == switches::kPpapiPluginProcess ||
type == switches::kRendererProcess ||
type == switches::kUtilityProcess || type == switches::kZygoteProcess;
From there we get to content_main_runner->Run(); which in essence does all the magic. Let's examine it under the hood. So content_main_runner is of class ContentMainRunner duhh.. which can be found at content\app\content_main_runner_impl.cc
To actually be able to understand the code flow for this we have to take it from the bottom to the top. And this being said , we scroll down again and we find that actually ContentMainRunner::Create() calls infact ContentMainRunnerImpl::Create(); which makes us realise that in fact we will have to search for ContentMainRunnerImpl definition not for ContentMainRunner, which we find in content_main_runner_impl.h in the same already mentioned folder.

We see that it inherits from ContentMainRunner and we can see it's core methods. Really there's not too much here as it's behaviour is mostly overwritten in content_main_runner_impl.cc
Inside content_main_runner_impl.cc, inside run method it first does some checking using DCHECK(what the hell is this function?(The CHECK() macro will cause an immediate crash if its condition is not met. DCHECK() is like CHECK() but is only compiled in when DCHECK_IS_ON is true (debug builds and some bot configurations, but not end-user builds). quotes from google docs :) ) to see if is_initialized,content_main_params_,is_shutdown_ are set.

Afterwards is gets the arguments and determines the type from which i have mentioned earlier
Than in case we can't find that we call InitializeFieldTrialAndFeatureList() delegate_->PostFieldTrialInitialization(); and post is as message using mojo.
 .
.
Next what it does is to sets some stuff for ui
again based on what it had been passed on command line and calls RegisterMainThreadFactories which is a wrapper for RegisterUtilityMainThreadFactory which only sets g_utility_main_thread_factory which by the name i think it creates the main thread which is like the thread which is the watcher for the rest of the threads and finally launches the browser process. 
In case you don't trust me here is chromium disassambled in binja and we will also see some in memory analysis of that
Lucky us, we have chome.exe.pdb which allows us to have debug symbols and we won't have any pain while reversing the binary
Since we work on chrome on windows, the main entry for the program is wWinMain:
Here is how the graph looks
 .
.
The function itself is heudge and such i wil only show the necessary parts of it. After a bunch of initialisations we get to a point where it calls MakeMainDllLoader()
 , which we have explained what it does. Right so how do we dynamically debug chrome and prove everything i have already mentioned ? first we load it in windbg, and than lm and look for the name of executable.After that we look for a function called chrome!MakeMainDllLoader, we set a bp and let the execution go.
 . we get inside of it
  let it run until it hits ret and we get out of it we we get into chrome!wWinMain+0x764
  . we than let it run until chrome!MainDllLoader::Launch and step into it. From there we bp at chrome!MainDllLoader::Load so we can see how chrome.dll is loaded into memory. And as we can see among the first things which was loade was chrome.dll
  From here the flow of analysis is the same and the full in memory analysis wil be left as an execise for the reader. For special purpouse i will do in the analysis up to the point where almost the content process is done and right before the browser process start there i will stop. The purpose of this is just to showcase how ipc start communicating between each other. Now after the loading of the dll, we will have to look for a call rax instruction. what i did was to list 0x40 instruction from current eip after loading dll.
 . at that address actually is what we are looking for which is chrome!ChromeMain.
 From there we want to break at
  which is basically a big check before jumping into content!content::ContentMain. from there we want to move over a few instructions and hit content!content::ContentMain. we want to step inside and break at content!content::RunContentProcess
 we want to step inside, and set a bp at content!content::ContentMainRunnerImpl::Run+0x430 and as soon as we step over
  we see mojo ipc starting and we conclude that the next process aka browser process is responsable for actuall browser implementation and handling of all the other processes.
===============================================================================================
Last time we left of after understanding content process. today we will go for browser process it's the process that is start after the content process and it's the second one in processes started by chrome. Let's briefly describe it:
- we can consider it the main process since the content process is more of a initialisation routine and some dependency checking,and it is started by the content process
- it stays alive throughout the browser's entire lifetime.
- It is the central coordinator of all the processes, and operates at the highest privilege level available to the browser.
- since it runs at highest privillege levels in case other processes need to achive a higher level operation, that request is handled by browser process.
- It controls features such as the address bar, bookmarks and the back/forward/reload buttons. Since this is the most privileged process it does not trust the data given to it by any of the other processes.
- also handles privileged operations such as UI, networking or filesystem storage for the other processes when necessary.
Now that we briefly know what it does it is time to go more indepth on it: Our journey starts atsrc\content\appin a file called content_main_runner_impl.cc at the function int ContentMainRunnerImpl::RunBrowser(MainFunctionParams main_params,bool start_minimal_browser) first operation it executes we see is a TRACE_EVENT_INSTANT0 .
.
What is that ? Before that what is even a trace function? Well if we go to https://lwn.net/Articles/379903/ we can see they define it as , doing a little bit of abstraction we can come to a conclusion that what a trace function is a function that records data at a specific point in a stackframe. It does more than recording the stack of execution function, it can record local variables of the last executed function.Now that we know what a tracefunction is let's see what our does.
If we go to https://chromium.googlesource.com/chromium/src/base/trace_event/common/+/refs/heads/main/trace_event_common.h we see that they define it as a function who's solve purpose is to "tracking application performance and resource usage". Going a little more indepth so we can understand what it does we see it's a macro and it is defined as
, doing a little bit of abstraction we can come to a conclusion that what a trace function is a function that records data at a specific point in a stackframe. It does more than recording the stack of execution function, it can record local variables of the last executed function.Now that we know what a tracefunction is let's see what our does.
If we go to https://chromium.googlesource.com/chromium/src/base/trace_event/common/+/refs/heads/main/trace_event_common.h we see that they define it as a function who's solve purpose is to "tracking application performance and resource usage". Going a little more indepth so we can understand what it does we see it's a macro and it is defined as  . We can see a short deffinition upper of the macro which says it record a single event called "name" immediately, with 0, 1 or 2 arguments. And in case the category of the belonging event is not enabled, it does nothing.We can see that as parameters we have "startup" as main category and as a subsystem we have "ContentMainRunnerImpl::RunBrowser(begin)" and the third paremets is TRACE_EVENT_SCOPE_THREAD which is "#define TRACE_EVENT_SCOPE_THREAD (static_cast(2 << 2))" which i think based on the value id a id for a the respective instant event. so in essence what this does it simply traces(logs) the fact the we have entered with our execution in the RunBrowser function . We than have a check to see if the browser main loop has already started and in case it has already started we exit the function
  . we than set a flag and after that we get to a rather interesting part of the code. We check if we have support for mojo_ipc mechanism and in case we do we use ShouldCreateFeatureList which creates a feature list with different processes tries to intialise them and finally tries to initialise mojo features.
 . we than create a threadpool.
 WTF is a threadpool???! Citying from wikipedia:"a software design pattern for achieving concurrency of execution in a computer program". More properly explained "a thread pool maintains multiple threads waiting for tasks to be allocated for concurrent execution by the supervising program"(still this quote from wikipedia"). More properly expalined imagine a two lines of people working in a factory. Lets call them line a and line b. They are all supervised by a boss. let's call him line c. now line b has to wait for line a to finish their job and be notified by line c in order to work. and same goes for line a. And this is what a threadpool is. Here is also a small c example
  . This is shamesly taken from https://stackoverflow.com/questions/15752659/thread-pooling-in-c11 .Next we have a call to PreBrowserMain(); which does some platform specific initialisation and after that we get to a point where we call
 BrowserTaskExecutor::Create();
 . Lets take a deep dive into what is does since the name is quite interesting and relying on an educated guess we can realise this might be interesting. Out detour begins inside of content/browser/scheduler/browser_task_executor.h where we find that BrowserTaskExecutor is a class which is supposed to "to map base::TaskTraits to actual task queues for the browser process." Going a little down over the file we first
  it inherits from BaseBrowserTaskExecutor. So now in order to understand what BrowserTaskExecutor we need to understand BaseBrowserTaskExecutor. we can see it inherits from TaskExecutor. Fortunatelly for us we see that it overwrites TaskExecutor's methods with overwriteable property which means that the'll be overwritten by other methods call later. But just for the currious people out there we can find it at base/task/task_executor.h and in case we inspect it we can find out that TaskExecutor is a class which " can execute Tasks with a specific TaskTraits extension id
  .
.
What is a task and what are tasktraits. We have already mentioned what is a task, but to refresh is one of a process of chrome's processes, and now what are TaskTraits?. They are located at base/task/task_traits.h and they are defined as follows "encapsulate information about a task that helps the thread pool make better scheduling decisions." Going back to our BrowserTaskExecutor. The method we call is Create() and it's analysis as it's follows first get check if the current task needs to run from a SingleThreadTaskRunner. aka if we need to run this task using an independent treadth.we do this by getting a pointer to tls. we than initialise an ui and & a thread scheduler. Basically here we init a scheduler for future events related to ui.
 .
.
And that's about it for that feature. moving on with the analysis of the content_main_runner_impl.cc we get here.
searching for the variations ids provider class file we find it at `components/variations/variations_ids_provider.h`, there we see something reather interesting. it include a `.mojom.h` file. we can find it's definition at `Debug/gen/components/variations/` variations.mojom.h ,which means it had to do something with the ipc mechanism. Now going over the actual definition of the class we see a comments which annotates as "A helper class for maintaining client experiments and metrics state transmitted in custom HTTP request headers." looking over it's behaviour and source definitionm se conclude it simply used as a marker for a function, which marks that "signed-in parameter supplied to GetClientDataHeaders()" which means somewhere in the stack execution there is a call to GetClientDataHeaders and later it will be called with a parameter. we than do delegate_->PostEarlyInitialization(!!main_params.ui_task); which simply posts to mojo's ipc that it has to start the ui tasks. we do more initialisation and than we get to call RunBrowserProcessMain.
  . If you hoped as me that this is where we see the gui starting , you are wrong . A quote from master oogwgay
  . we than go and do some more checking and we hit BrowserMain
 . going over it it does some tracing and than we get to
 which is where we actually start the gui. Now in case you don't trust me you will have to be a little more patient until we get to dynamic analysis. we than get to Run method which is the actual stuff we interested for that following that we will get to our next point for next point of understanding browser process. But for now let's take another short de-tour and investigate how Initialize method is created . Right of we see it traces the execution of init method and before that it creates a histogram
 . we than check the initialization_started_ flag to see if we got to initialisation stage and in case we didn't , we init skia which is graphics library used by chrome,start a "timer" to count the second elapsed for running this method for later use in a histogram, check if we passed a param to binary to wait for debugger to attach to the process and finaly start a notification_service_ which by using an educated guess will notify the main watcher of threadpool when to start a service.
  . we than initialise the necessary fonts for chrome and create the mainbrowserloop, which is the coordonator for all processes and we jump over three methods which don't show any interest for us main_loop_->CreateStartupTasks();
int result_code = main_loop_->GetResultCode(); . from here what we are interested in to go into CreateStartupTasks. from there we look at content\browser\browser_main_loop.cc, we are interested startup_task_runner_->RunAllTasksNow(); which is inside createstartuptask method. starup_task_runner_ is a StartupTaskRunner which is located in same directory inside startup_task_runner.cc file. Now if we inspect RunAllTasksNow method we see what it does is simply iterate over all tasks and run them
. we than initialise the necessary fonts for chrome and create the mainbrowserloop, which is the coordonator for all processes and we jump over three methods which don't show any interest for us main_loop_->CreateStartupTasks();
int result_code = main_loop_->GetResultCode(); . from here what we are interested in to go into CreateStartupTasks. from there we look at content\browser\browser_main_loop.cc, we are interested startup_task_runner_->RunAllTasksNow(); which is inside createstartuptask method. starup_task_runner_ is a StartupTaskRunner which is located in same directory inside startup_task_runner.cc file. Now if we inspect RunAllTasksNow method we see what it does is simply iterate over all tasks and run them
========================================================================================== Time for sone dynamic analysis
Now in order to catch the renderer wil will have to start the binary in windbg. that is simply achivable by doing File->Open Executable and passsing --renderer-startup-dialog --no-sandbox --wait-for-debugger-children=renderer --renderer-process-limit=1 as arguments. . we than set a bp at content!content::StartupTaskRunner::RunAllTasksNow+0x88 so we can catch the ipc messeges and later the renderer.just as a reference poin this is how your dbg should look after running it once
  . you should see the chrome is running in full browser mode message. from there you run counting from one to 5 so you run it another four times. and than you should see something like
  . i recommand using procmon so you can monitor the renderer process when it starts. after that you hook it into another debugger ,and in case you used the upper arguments you should see a message box popping telling you the renderer pid
 . from ther you will want to bp at base!base::RunLoop::Run. Unfortuntally you can't break at content!content::RendererMain for some reason. maybe because we hook the process right after it exits the renderemain function and it's run by a thread. Regardless here is how the ipc looks after four runs.
 . This indicates that the gui is started. and here is how the ipc looks after renderer process starts.
 . We than set a bp at
content!content::StartupTaskRunner::RunAllTasksNow+0x88 and content!content::RunOtherNamedProcessTypeMain. Let it run
. We than set a bp at
content!content::StartupTaskRunner::RunAllTasksNow+0x88 and content!content::RunOtherNamedProcessTypeMain. Let it run
============================================================================================================
3.Now for the second part of browser process analysis we got to the point where we will be able to understand and debug the renderer, but we won't go there yet. I explicitly left one more function to analyse after RunBrowserProcessMain, well theoreticall it's after RunBrowser, but as you may recal RunBrowser is a wrapper for RunBrowserProcessMain. Now what i left outside is that in the file called content_main_runner_impl.cc in the folder src/content/app there is another function which is called after we spawn the renderer and it's called RunOtherNamedProcessTypeMain. This process is incharge for running all the other processes. . now let's understand what happends in the code.We see it's prototype is
  , which indicates that it will take the arguments passed to cmdline, which process type to expect and a chrome delegate.We than get to the beginning of the function where we have a macro definition to check for platform specifics and check for which process to instantiate a event handler. aka to check to see if it runs some functions for console process or for the browser process.
  . We than iterate over the passed processes and compare it to a list of knows processes and run the respective process.
  In case we don't get the respective process than it's a custom process implemented by someone
 Here is a link to implement custom process and we will use this example for the second part of dynamic analysis . https://bitbucket.org/chromiumembedded/cef/wiki/Tutorial .
=====================================================================
Dynamic Analysis Part
First part of the dynamic analysis starts as follows: first run from a cmd.exe with admin right the following command: windbg.exe chrome.exe -G -o --renderer-startup-dialog --no-sandbox --wait-for-debugger-children=renderer --renderer-process-limit=1 --allow-pre-commit-input --allow-sandbox-debugging . After that set .childdbg 1 so we can debug new spawned child processes. In essence what the upper command does is "ensure you are attached to all child processes". Shout out goes to @spoofyroot and @_coreDump for pointing me into the right direction with mutliprocess debugging. Here is how it's supposed to look after setting .childdbg 1  Now as i wasn't able to capture in any other method what happends next i made a video which i will explain what happends next. https://streamable.com/9t4iof . Basically after we run for last time content!content::StartupTaskRunner::RunAllTasksNow+0x88 we spawn new processes which handle some ipc stuff and we will have to keep setting a bp at content!content::RunContentProcess until he hit it. This is what i call educated trial and error:)) .
=====================================================================
4.Renderer Analysis
!Disclaimer While we will do the analysis of the Renderer code, we will dive a little also into blink code so we can understand what happends properly in the renderer
While writing this part of the course i realised i forgot to briefly describe what this do and we do we even look into it.As we know this is the third processes started by chromium and it's called the renderer. But why is it called the "renderer".It's called so because it's job is to rendere(draws) everything we see on a website. Basically this is the reason why your table looks like a table when you go over a website or your css makes it possible to customise a piece of text. Or why your js is able to do black magic*. Another important reason why we analyse this is because this is from where the most of the bugs come. Wheter we talk about html , css , or js or any other componenet you will all see them under blink on chrome bugs.chromium.org
-
There are more renderer processes. One entirely separate process for each tab the browser currently has opened.
-
This process controls anything inside the actual website tab
-
starting with 2018, iframe received an upgrade where they all can have tabs. and such each tab of an iframe has an individual renderer process. This is called Site-Isolation
-
It's responsability is to parse a website, draw on your screen what the website has inside of it eg. tables,images, execute javascript
-
it is sandboxed
-
at the core it uses a rendering engine called Blink.
-
create, and handle url-schemes such as : chrome://, devtools://, chrome-error://
-
Initialise Blink engine which will actually do all the parsing and the heavy lifting for the renderer process.
Last time we left we finished the browser process analysis and now it's time we have all been waiting for to go and do the renderer analysis part. Right, when i was playing with chromium i managed to make it crash and i got the following stack trace.  Based on this we know out journey starts at content::RendererMain which is located in
 \content\renderer\renderer_main.cc . You guest it out starting point is RendererMain. Lets start by analysing how it's defined and a little bit inside of it  . We can see it accepts a parameters which is of type MainFunctionParams which means this function will accept the passed arguments to the binary. Next we add a trace point so we can know that we got to calling RendererMain, and than dereference the value of parameters and save it into command_line. Than we have some macros which check for platform specific architecture which we can ignore
  , we check for value passed to kTimeZoneForTesting which is a time zone to use for testing, than we get to meet a new class and data type used call icu.
 Now searching for any source of defintion for that we arrive at https://unicode-org.github.io/icu-docs . If we look at the beginning of the file where the include directive is we can see it's a third party library. So until now we know it is a third party library which deals with international componenets for unicode aka we use this for unicode support. Ok but what does that function do? Going over https://unicode-org.github.io/icu-docs we see
  , aka sets the default time zone based on what we set as parameters. We than init skia library and handle --renderer-startup-dialog
 . We are than meet by a new class RendererMainPlatformDelegate.
What this do ? Well first we have to specify this is an abstract class which is platform specific. for our case it will be located at /content/renderer inside of the file called renderer_main_platform_delegate_win.cc . It looks like this
 . So we can conlude that all that's is is a helper function which does enabling of sandbox in case we pass --no-sandbox do the necessary actions and that's about it.We than set the name of our thread to CrRendererMain
 . We than get to meet yet another new class called RenderThread.
  Again since we are basically unaware of what it does let's explore it a little bit . Our quest in understanding how RendererThread looks like starts at content/public/renderer/render_thread.h. Looking inside of the file render_thread.h we see it's defined as
  . Out of that whole file we are interested in IsMainThread which is defined in file rendere_thread.cc and it looks like this
  (sa adaugi o lunga descriere despre acest mechanism). Now going further with the analysis of rendere code we can see the most awaited moment and that is we finally get to see some blink code. First of it's kind and what it does it initialises the library.
 . Behind the courtains the function looks like this
  . Now the natural question that arrises is wtf are thoese classes ? What is WTF and Platform. Lucky us, the docs of blink actually tells us what are thoese.
https://docs.google.com/document/d/1aitSOucL0VHZa9Z2vbRJSyAIsAz24kX8LFByQ5xQnUg/edit . Looking at "Directory structure and dependencies" we can deduce that platform is a class that help with geometry and graphics. Now on WTF and Partitions classes. Blink docs also say about WTF: it comes from Web Template Framework and it's much of a stl library "wrapper" as in " is a base library for Blink providing a variety of basic functionalities, like containers, string libraries, reference counting mechanisms, functors, threading primitives etc."(quotes from blink docs(https://chromium.googlesource.com/chromium/src/+/refs/heads/main/third_party/blink/renderer/platform/wtf/README.md)).Sa mai adaugi detalii despre blink
Ok now going further with the analysis of renderer_main.cc we see something again which we are not aware what it does and it's and is
. Now the natural question that arrises is wtf are thoese classes ? What is WTF and Platform. Lucky us, the docs of blink actually tells us what are thoese.
https://docs.google.com/document/d/1aitSOucL0VHZa9Z2vbRJSyAIsAz24kX8LFByQ5xQnUg/edit . Looking at "Directory structure and dependencies" we can deduce that platform is a class that help with geometry and graphics. Now on WTF and Partitions classes. Blink docs also say about WTF: it comes from Web Template Framework and it's much of a stl library "wrapper" as in " is a base library for Blink providing a variety of basic functionalities, like containers, string libraries, reference counting mechanisms, functors, threading primitives etc."(quotes from blink docs(https://chromium.googlesource.com/chromium/src/+/refs/heads/main/third_party/blink/renderer/platform/wtf/README.md)).Sa mai adaugi detalii despre blink
Ok now going further with the analysis of renderer_main.cc we see something again which we are not aware what it does and it's and is  Sa adaugi detalii maine.We than call
  .We than check to see if we have enabled plugin when compiling and in case we did we load them.
 We than do some more checking which i decided to skip explaining because it's getting quite a long explanation and they are not necessary at this stage. But on on TL;DR version it's to whether to enable or not the sandbox before RenderProcess initialization.And than we finally get to
  .(sa adaugi restu detaiilolr despre restu fcctilor). While this is not the end of the renderer analysis we can conside it the beginning point of the actual rendere analysis cause as we will se later here happends most of the interesting stuff so we can conside it as the code of the renderer. We are interested in RenderThreadImpl,which looks like
  . From all that code we are interested in Init() function,which looks like this:
 , but it's a lot longer. :) we can't capture it in a single picture unfortunatelly, and such we captured it's beggining. Aside that everything else that happends further from InitializeWebKit(), is not really in our interest since most of it is just ipc communication with the gpu process, which is not on our radat atm. Fortunes smiles upon us cause in that function we also caught one of the functions we are interested precisly InitializeWebKit() ,which again looks like
  .We digress a little bit form out quest of explain renderer_main.cc in order to better understand what happends insde of InitializeWebKit. Niw i know it's a lot to understand byt bare with me as we try to make some sens over this mess. So we see InitializeWebKit() stats by taking whatever arguments was passed to this process than we check to see it we have enabled when compiling -dENABLE_VTUNE_JIT_INTERFACE, and in case we did we check for passed option to cmdline which is enable-vtune-support. WTF is that ? We seached on google and we find a link to https://www.intel.com/content/www/us/en/develop/documentation/vtune-help/top.html and on that page it says its: "is a performance analysis tool for serial and multithreaded applications". so tl;dr something that improves your chrome performance.We than initialise blink
  . Now in order to understand the process of blink initialisation lets explain briefly as we will go into detail into next chapter which will look indepth over blink. we are met by another class which is a stranger for us and that is RendererBlinkPlatformImpl, which looks like
 and can be found at
content/renderer/renderer_blink_platform_impl.cc . Based on the name we can conclude it's an abstract class is is implemented based on the platform and we can also see it inherits from
and can be found at
content/renderer/renderer_blink_platform_impl.cc . Based on the name we can conclude it's an abstract class is is implemented based on the platform and we can also see it inherits from  Going over what RendererBlinkPlatformImpl actually does we see it checks for platform based and than results of the ckec it marks a flag,
 than checks to see it the current thread is a RendererThread by getting a poiter to tls
blah blah blah vezi daca mai adaugi continut despre clase. We than arrive at something we all might have been waiting and that's it first piece of v8 code. Which is  . What this do ? First of all we know from docs that a v8::isolate is a instance of the V8 engine. aka(an independent copy of the V8 runtime, including a heap manager, a garbage collector, etc) not sufficient for running scripts . we see blink::MainThreadIsolate() defined as
 which is in file blink/renderer/platform/bindings/v8_per_isolate_data.cc , which in terms V8PerIsolateData::MainThreadIsolate() looks like
 , V8PerIsolateData which in terms you gest it is also an
class which is found in bindings/core/v8/V8PerIsolateData.h looks roughly like
, V8PerIsolateData which in terms you gest it is also an
class which is found in bindings/core/v8/V8PerIsolateData.h looks roughly like  blah blah bladh adaugi detalii. We than check if we passed kDisableThreadedCompositing(sa agaugi maine cum arata flagu defapt)to command line
 . in case we didn't we start a compositor thread. WTF is that ? Citing from https://frontendmasters.com/courses/web-performance/the-compositor-thread/ , it's a thread who's s "sole job is to draw bitmaps, take the bitmaps, send them to GPU, put them on the screen". We than register what is called a scheme.
 Basically do you remember when viewing source that u have something in front of the url like: "view-source:website" . Yeah that's actually handled by renderer. And there are more of these schemes. What do they mean by registering ? I am not shure yet but i think they mean like hey this is something i want you to handler when user comes and does this thing. Anyways this is how it looks.
 sa adaugi mai multe detalii. bun acu cand agaug sa detailizii si ultima bucata de cod
  . balh balsdld and finally we got to final part of renderer_main sa updatezi cu detalii

=====================================================================
Dynamic Analysis Part
Now in order to be able to debug it dynamically, in case you are as noob as i am you will want to run windbg from cmd.exe as follows windbg.exe chrome.exe -G -o --renderer-startup-dialog --no-sandbox --wait-for-debugger-children=renderer --renderer-process-limit=1 --allow-pre-commit-input --allow-sandbox-debugging --time-zone-for-testing="US/Pacific", and set .childdbg 1 in order to be able to debug the spawned child process. From there you will want to bp content!content::RendererMain and let it run for like 5 or 6 times. (sa modifici safaci referinta la 4 la video ca e mai clar asa) after that we got to  .
.


