Normalization
-
Certain machine learning algorithms (such as SVM and KNN) are more sensitive to the scale of data than others since the distance between the data points is very important.
-
In order to avoid this problem we bring the dataset to a common scale while keeping the distributions of variables the same. This is often referred to as min-max scaling.
- Suppose we are working with the dataset which has 2 variables: height and weight, where height is measured in inches and weight is measured in pounds.
- Even prior to running any numbers, you realize that the range for weight will have larger values than the range for height.
- In our daily life we would think that the range for height can be somewhere between 65 and 75 inches (my assumption), while the range for weight can be somewhere between 120 and 220 pounds (also my assumption).
- Standardization: Transforming data into a z-score or t-score i.e. transform data to have a mean of 0 and standard deviation of 1
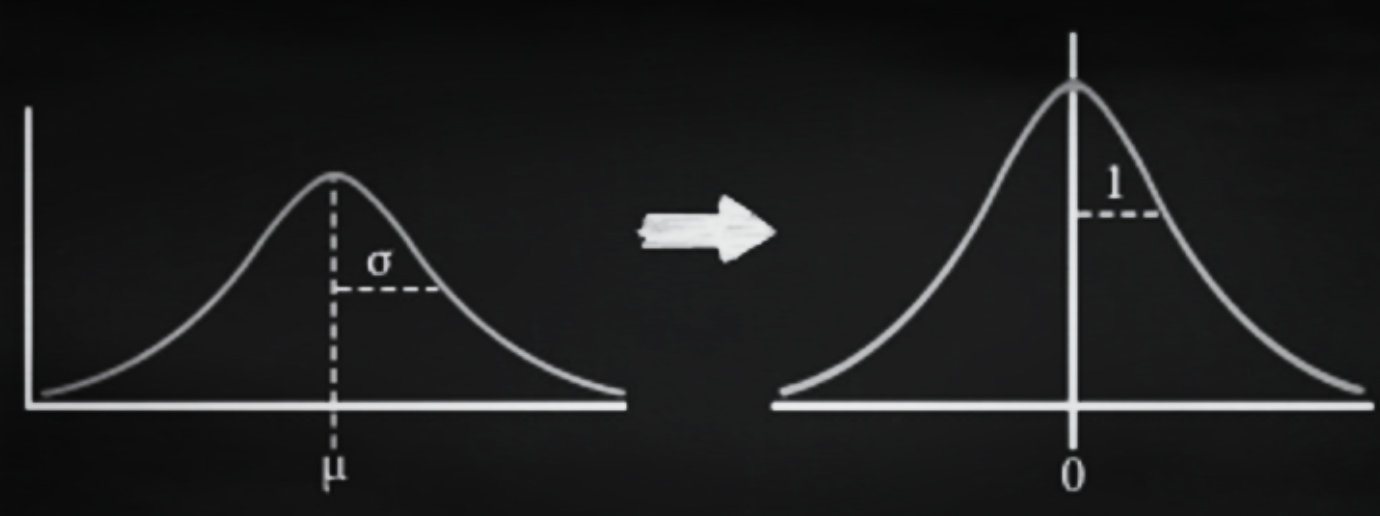
* Feature Scaling: Rescaling data to have values between 0 & 1.

* Normalizing Moments: using the formula μ/σ.
Below are the steps we are going to take to make sure we do learn how to normalize data in R:
- Loading sample dataset: cars
- Creating a function to normalize data in R
- Normalize data in R
- Visualization of normalized data in R
- The dataset I will use in this article is the data on the speed of cars and the distances they took to stop.
- It contains 50 observations on speed (mph) and distance (ft).
- This dataset is built into R so we don’t need to import it from any external source rather than just “call” it into our environment.
- I will store it as “mydata”:
mydata<-cars - Now you can take a look at the dataset and the variables it contains:
View(mydata)
As I mentioned earlier, what we are going to do is rescale the data points for the 2 variables (speed and distance) to be between 0 and 1 (0 ≤ x ≤ 1).
What we need to do now is to create a function in R that will normalize the data according to the following formula:

-
Running this formula through the data in the column does the following: it takes every observation one by one, the subtracts the smallest value from the data. Then this difference is divided by the difference between the largest data point and the smallest data point, which in turn scales it to a range [0;1].
-
Logically, the rescaled value of the smallest data point will be 0 and the rescaled value of the largest data point will be 1.
-
Now, let's code this process out!
-
I believe there are packages that have this command built-in by now, but when I was working on my first algorithm, I made my own function for it due to time constraints.
-
Let's call our function
normalize().
normalize <- function(x) { return ((x - min(x)) / (max(x) - min(x))) }
- The above command will do exactly what I described with the formula.
-
I would prefer to create new columns in the same data frame with the normalized data for each of the variables.
-
Let's call the new columns "speed_norm" and "dist_norm".
-
The function will run through each row of the column we set it to work on and convert each data point to a normalized data point.
-
The code for each of the columns is the following:
mydata$speed_norm<-normalize(mydata$speed) mydata$dist_norm<-normalize(mydata$dist) -
We have just created two new columns with normalized data for "speed" and "dist" variables.
-
Take a look at your dataset now:
View(mydata)
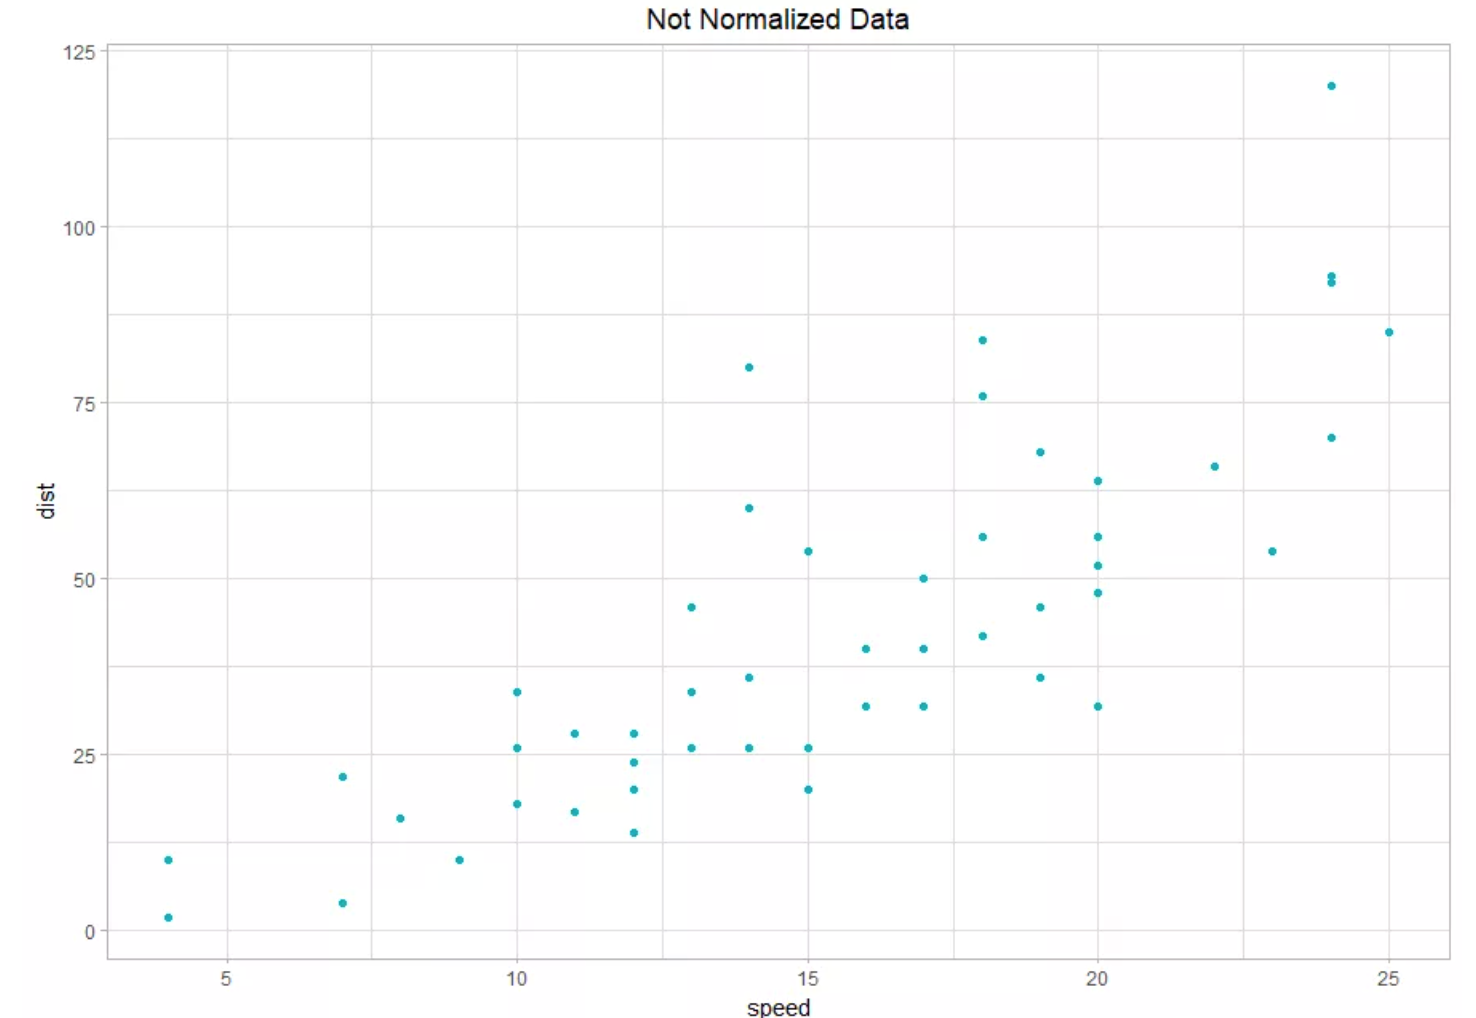
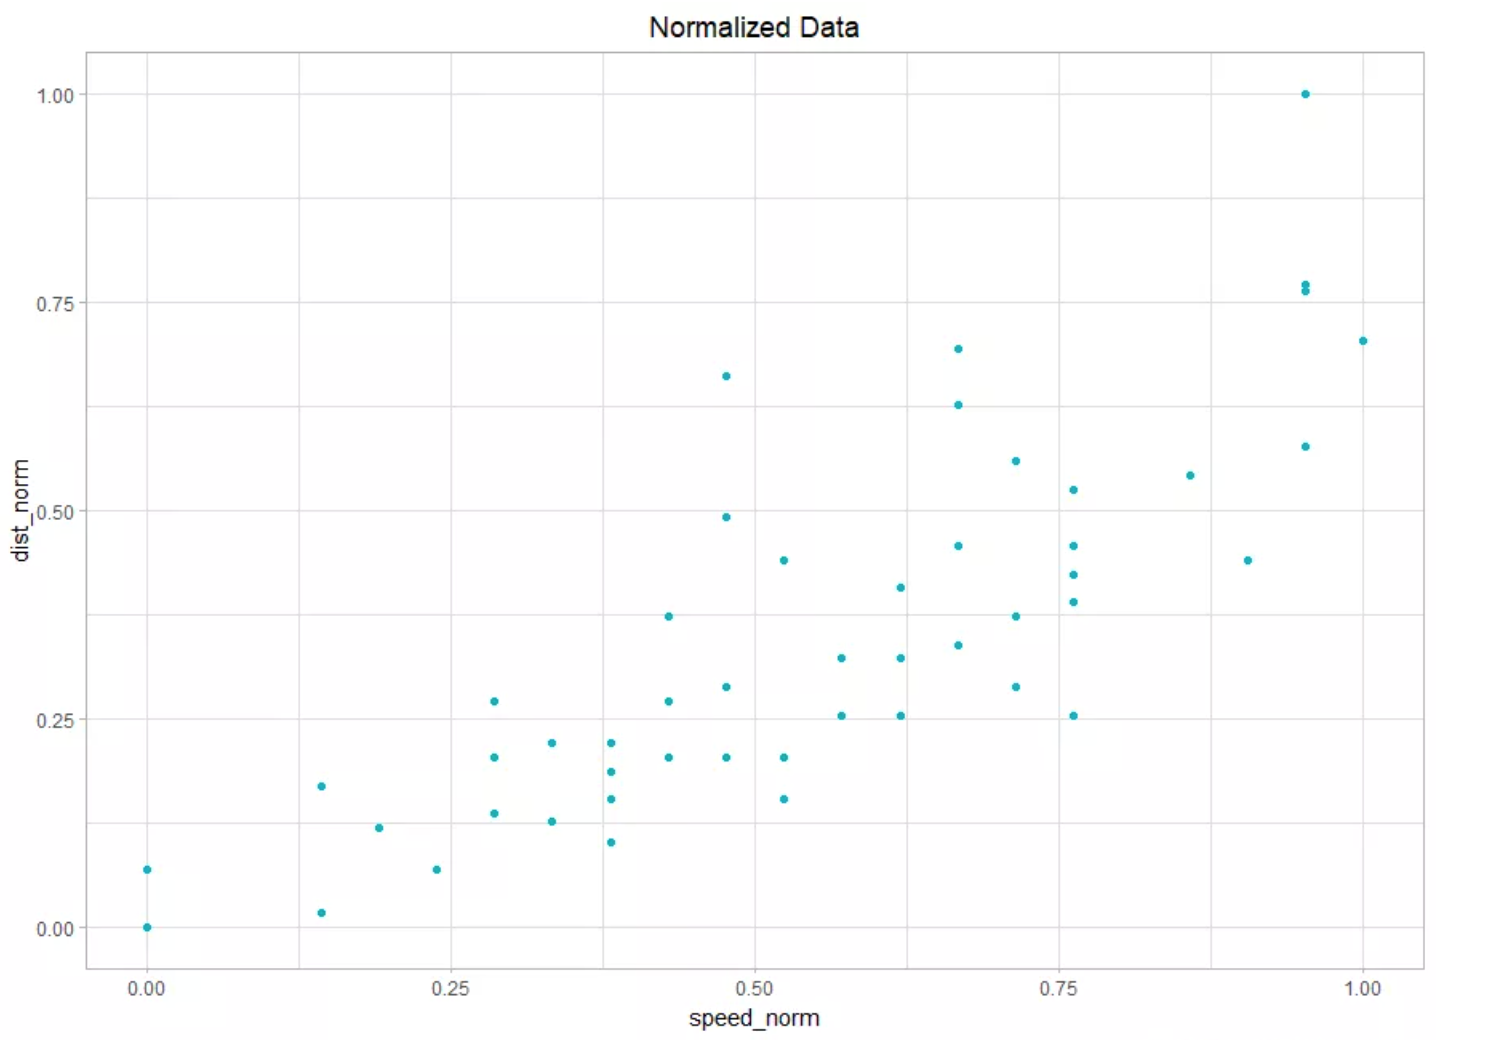
- The difference can be found between normalized and un-normalized data by plotting them.
- Plot a Scatter graph between "speed and dist" & "speed_norm and dist_norm"
- The output result would be something like this: