Home
This document explains in detail how to create charts and graphs using the TeeChartJS library.
Adding charts to your web pages or applications is fun and easy!
See the one-minute Creating a simple Chart guide below, play with the Online Demos or discover the full API Reference.
Compared with other programming environments (Java, .NET, Delphi VCL / FireMonkey, etc), the TeeChartJS API implements an essential subset of features in order to minimize both the script size and coding complexity.
Current script sizes are 111KB (minified) and 32KB (gzipped).
- Add the TeeChart script to your html page, preferabily at tag:
<script src="https://www.steema.com/files/public/teechart/html5/latest/src/teechart.js" type="text/javascript"></script>- Add the html5 canvas tag to display the chart:
<canvas id="canvas" width="300" height="200">
This browser does not seem to support HTML5 Canvas.
</canvas>- Add code to create a Chart with sample data:
<script type="text/javascript">
function draw() {
Chart1=new Tee.Chart("canvas");
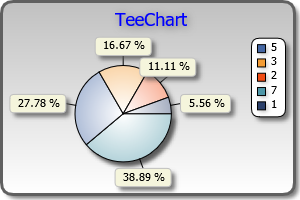
Chart1.addSeries(new Tee.Pie([5,3,2,7,1]) );
Chart1.draw();
}
</script>- Call the
draw()function from the appropriate place, for example at bodyonloadevent:
<body onload="draw()">The resulting output chart is a live chart looking like this static image (we can't put he live version in this wiki):
The above code does the following:
- Creates a Chart object, passing the canvas "id" as a parameter.
- Calls the Chart addSeries method, passing a new "Pie" series object, filled with an array of data numbers.
- Calls the Chart draw() method to generate and display the chart into "canvas".
Notes:
- The "Tee." prefix refers to all contents inside TeeChart.js script. This prefix is necessary to avoid conflicts with potentially equal named global namespace objects.
- The canvas "id" parameter can also be a DOM object, for example: "new Tee.Chart(document.getElementById("canvas"))".
- In this limited version, available series styles are "Line", "Bar", "HorizBar", "PointXY", "Area", "HorizArea", "Pie", "Donut" and "Bubble".
- Many series can be added and mixed to the same chart, but mixing Pie or Donut with non-circular styles might not be visually pleasant.