Simple Chart
- Add the TeeChart script to your html page, preferabily at tag:
<script src="https://www.steema.com/files/public/teechart/html5/latest/src/teechart.js" type="text/javascript"></script>- Add the html5 canvas tag to display the chart:
<canvas id="canvas" width="300" height="200">
This browser does not seem to support HTML5 Canvas.
</canvas>- Add code to create a
Chartwith sample data:
<script type="text/javascript">
function draw() {
  Chart1=new Tee.Chart("canvas");
  Chart1.addSeries(new Tee.Pie([5,3,2,7,1]) );
  Chart1.draw();
}
</script>- Call the
draw()function from the appropriate place, for example at bodyonloadevent:
<body onload="draw()">The resulting output chart is a live chart looking like this static image (we can't put he live version in this wiki):
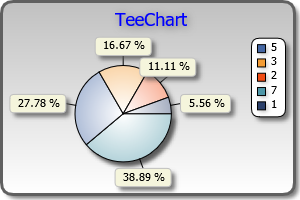
The above code does the following:
- Creates a
Chartobject, passing the canvas "id" as a parameter. - Calls the
ChartaddSeriesmethod, passing a newPieseries object, filled with an array of data numbers. - Calls the
Chartdraw()method to generate and display the chart into "canvas".
Notes:
- The
Teeprefix refers to all contents inside TeeChart.js script. This prefix is necessary to avoid conflicts with potentially equal named global namespace objects. - The canvas "id" parameter can also be a DOM object, for example
new Tee.Chart(document.getElementById("canvas")). - Available series styles here.
- Many series can be added and mixed to the same chart, but mixing Pie or Donut with non-circular styles might not be visually pleasant.