![]()
![]()
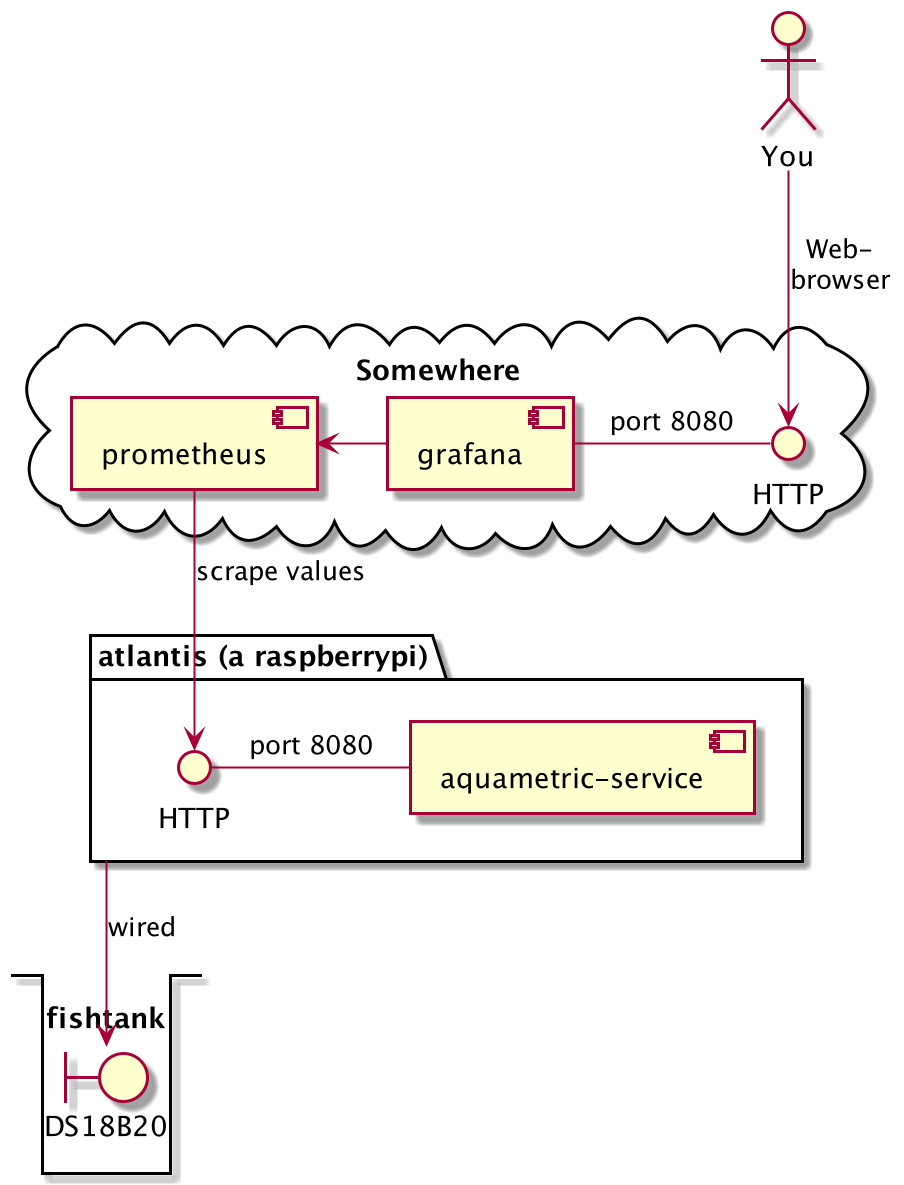
This project contains a java application which is designed to work on a raspberryPi and to read connected sensor data to provide them via a small microservice in prometheus way.
Thus a prometheus instance can collect the data and you will be able to display and analyse it via grafana.
WARNING: Having open electric circuits near saltwater can be potentially dangerous. Do not follow this setup unless you are experienced with this type of work and know what you are doing and how to secure your setup. Meaning I take no responsibility or liability of your work.
| Preview | Remark |
|---|---|
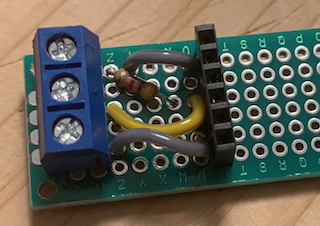 |
I'm not sure how my sensor will react to the seawater. It might be that I need to replace it after a while so I choosed not to solder the wires onto the board and use the blue screw thing which makes it easy to mount a new one. |
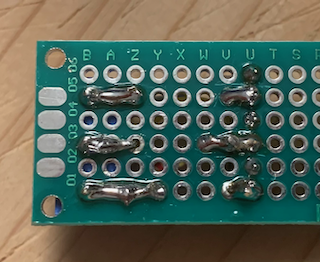 |
My first soldering work after 20 years. Please don't blame me. I choosed to leave a spare lane between to connected ones, as I didn't trusted my soldering capabilities. |
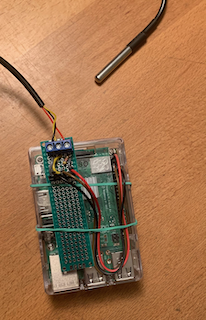 |
This is the result. Meanwhile up and running :-) |
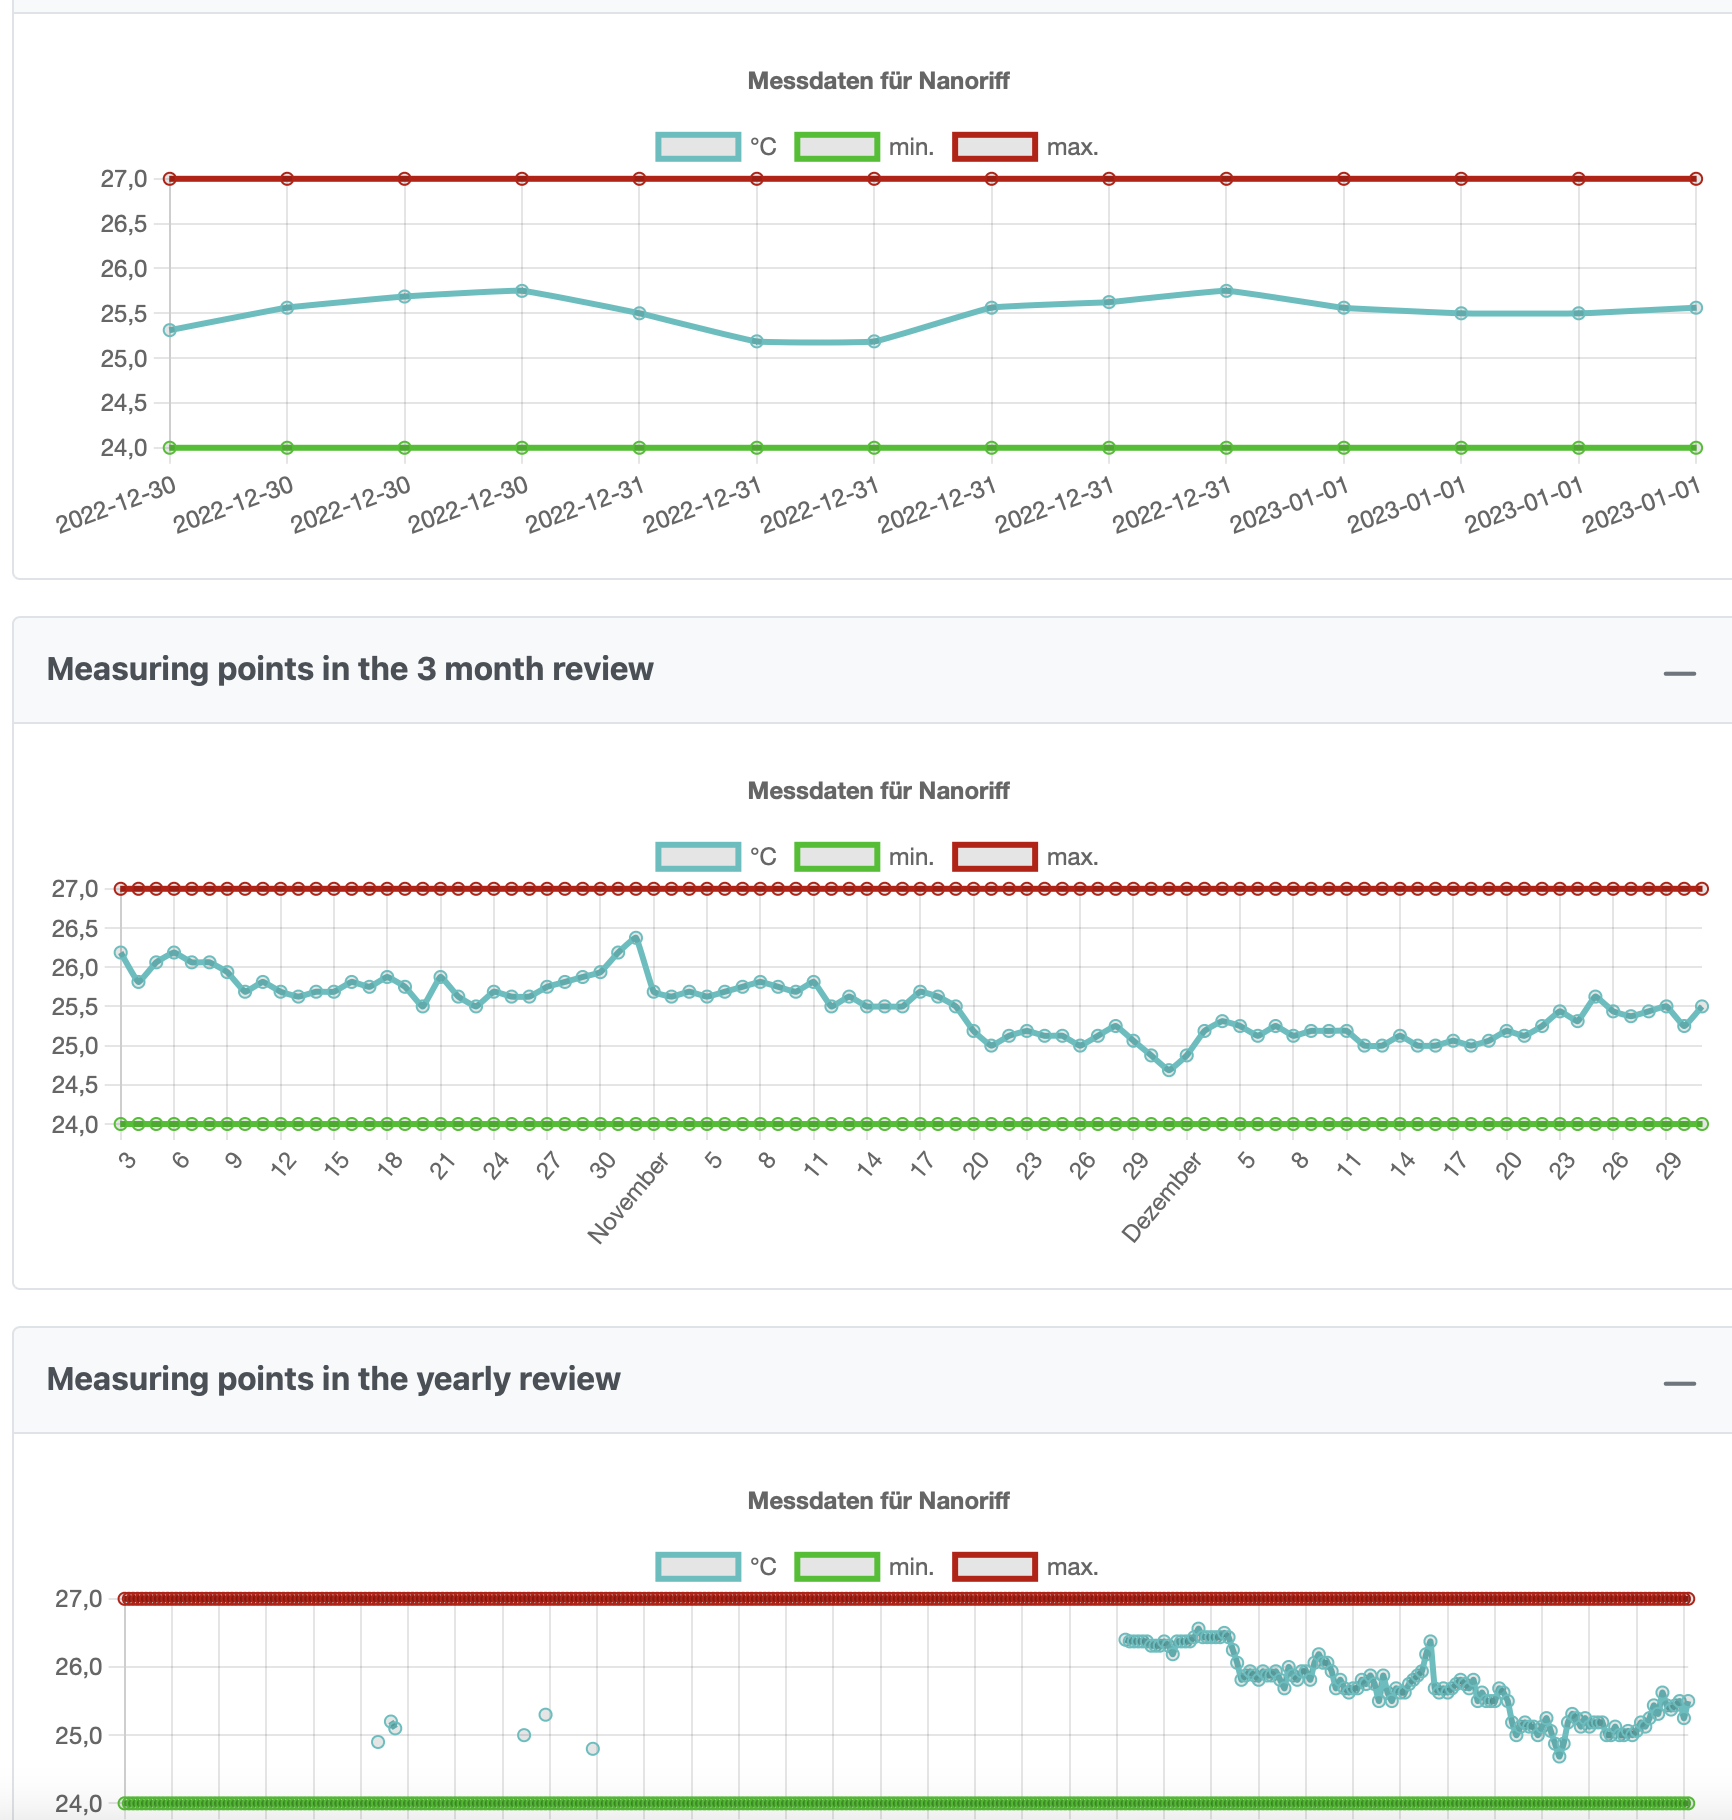
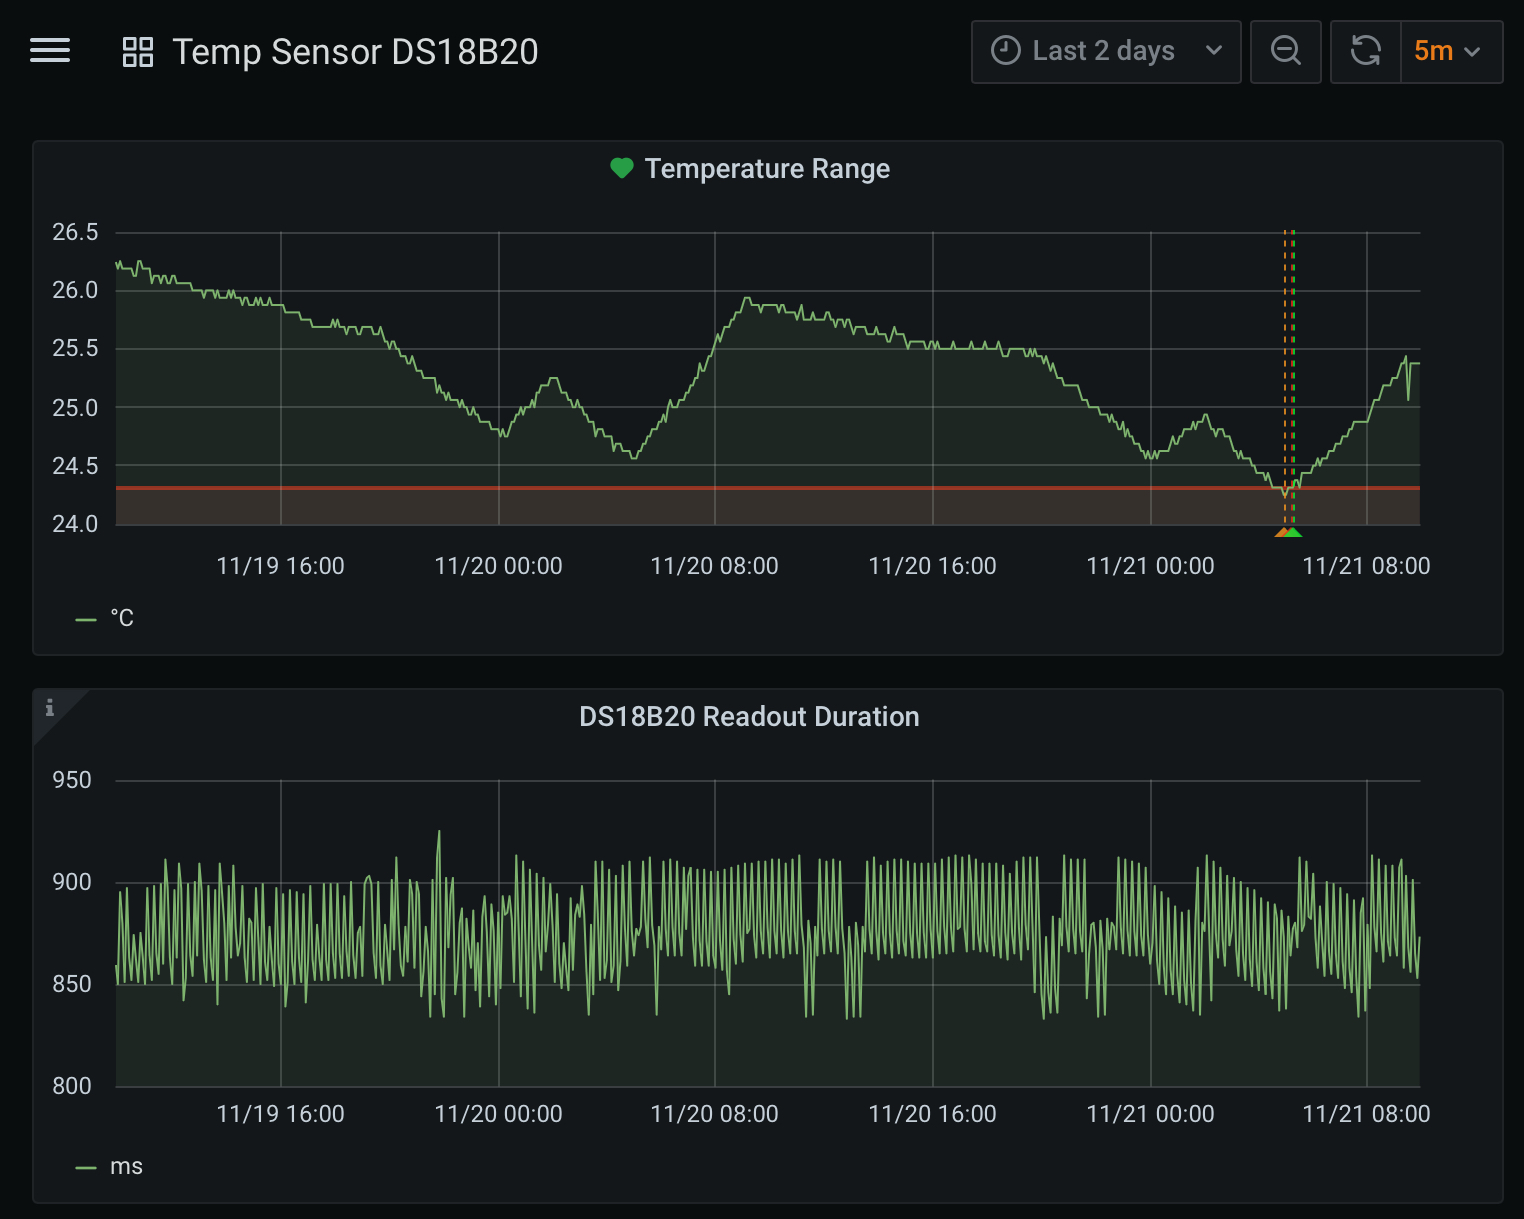 |
And this is what it looks like with a simple grafana board displaying the values. By the way I'm using grafana to set threshhold and email alerting. |
Burn a SD Card (16GB) with the latest Raspbian (CLI-Edition, no Desktop) Connect the pi to a lan cable (only temporarily), hdmi, keyboard
-
Connect to atlantis with default credentials (pi/raspberry)
sudo raspi-config- Choose a hostname (for this sample atlantis)
- Change login credentials
- Activate SSH network service
- Configure locale, keyboard, timezone
- Configure WLAN
- In Interface Options: activate the 1-wire protocol
Upgrade the system
sudo apt-get update
sudo apt-get upgrade
Copy the ssh key of your workstation/laptop to the pi to ease ssh connect (ommit this if you are not familiar with it)
ssh-copy-id -i id_rsa.pub pi@atlantis
Configure unattended upgrades for security
sudo apt-get install unattended-upgrades apt-listchanges
sudo nano /etc/apt/apt.conf.d/50unattended-upgrades
The editor pops up, clear all an insert this:
Unattended-Upgrade::Origins-Pattern {
        "origin=Raspbian,codename=${distro_codename},label=Raspbian";
        "origin=Raspberry Pi Foundation,codename=${distro_codename},label=Raspberry Pi Foundation";
};

Unattended-Upgrade::Mail "pi";
Unattended-Upgrade::Automatic-Reboot "true";
Unattended-Upgrade::Automatic-Reboot-Time "02:00";
Install some additional packages
# So that unattended upgrades can deviler mails
sudo apt-get install mailutils

# and that your local user can read them on the console using mutt
sudo apt-get install mutt

# Install Java using sdkman which is required to run our microservices
curl -s "https://get.sdkman.io" bash
source "$HOME/.sdkman/bin/sdkman-init.sh"
sdk install java <tab to see selection - Choose a 21 variant>

sudo ln -sf /home/pi/.sdkman/candidates/java/current/bin/java /usr/bin/java
Create a own user for our microservice
sudo adduser --home /var/aquametric --shell /usr/sbin/nologin aquametric
choose an arbitrary password and name like "aqua computer" when prompted and leave the rest as default.
Do a
sudo shutdown -r now
and disconnect the Pi from the LAN. After 2min you should be able to ssh into the pi via WLAN. If noit reconnect the LAN cable and check the WLAN settings you provided via raspi-config.
-
You have a JDK21 and current Maven installed
-
You have docker installed on your machine, and you know docker usage fairly well.
-
As we are using the org.owasp dependency check you will required to register yourself at https://nvd.nist.gov/ to get an API-KEY, which you can store in the properties section of your local settings.xml like this:
  <properties>
      <nvd.api.key>YOUR_API_KEY</nvd.api.key>
  </properties>
Easy - as you have maven installed a
mvn clean package
will do the trick. Afterwards you will find the target/aquametric-1.0-SNAPSHOT.jar
The deployment via ansible on single rasperry-pi's is like using a sledgehammer to crack a nut, it is unsuitable here but I had it already a blueprint so it was easy to adopt.
- Ansible and ssh are available
- The ssh private key of the executing user has been published onto the 'pi' account.
- You have edited the application.properties value for "ds18b20.device.id"
- You have edited the ansible/hosts file containing the hostname of yor target pi (if you changed it)
Execute something on all pis
ansible aquapis -i hosts -u pi -a "/bin/uname -a"
or check the unattended update logs
ansible aquapis -i hosts -u pi -a "tail -n20 /var/log/unattended-upgrades/unattended-upgrades.log"
Build the new aquametrics release and then from the ansible dir
(For your local copy only: edit deployAquaMetricsService.yml lookup the section with application.properties and uncomment the section to become active. I have spared the section out, because I won't share my sabi ApiKey with the world, by checking the value back in github).
ansible-playbook -i hosts deployAquaMetricsService.yml
wait 2 min and then do the endpoint test. Your service should be up and running and do so even after restart.
Optional, if you want them on the Pi too, and don't have them running already elsewere:
ansible-playbook -i hosts deployMoniotoring.yml
After that you should see some more services running at you pi:
- Prometheus: http://cody:9090/targets?search=
- Grafana: http://cody:3000/
You may follow my circuit board layout for the soldering work,
but you are free to use your own design for the wiring with
the material available ;-)
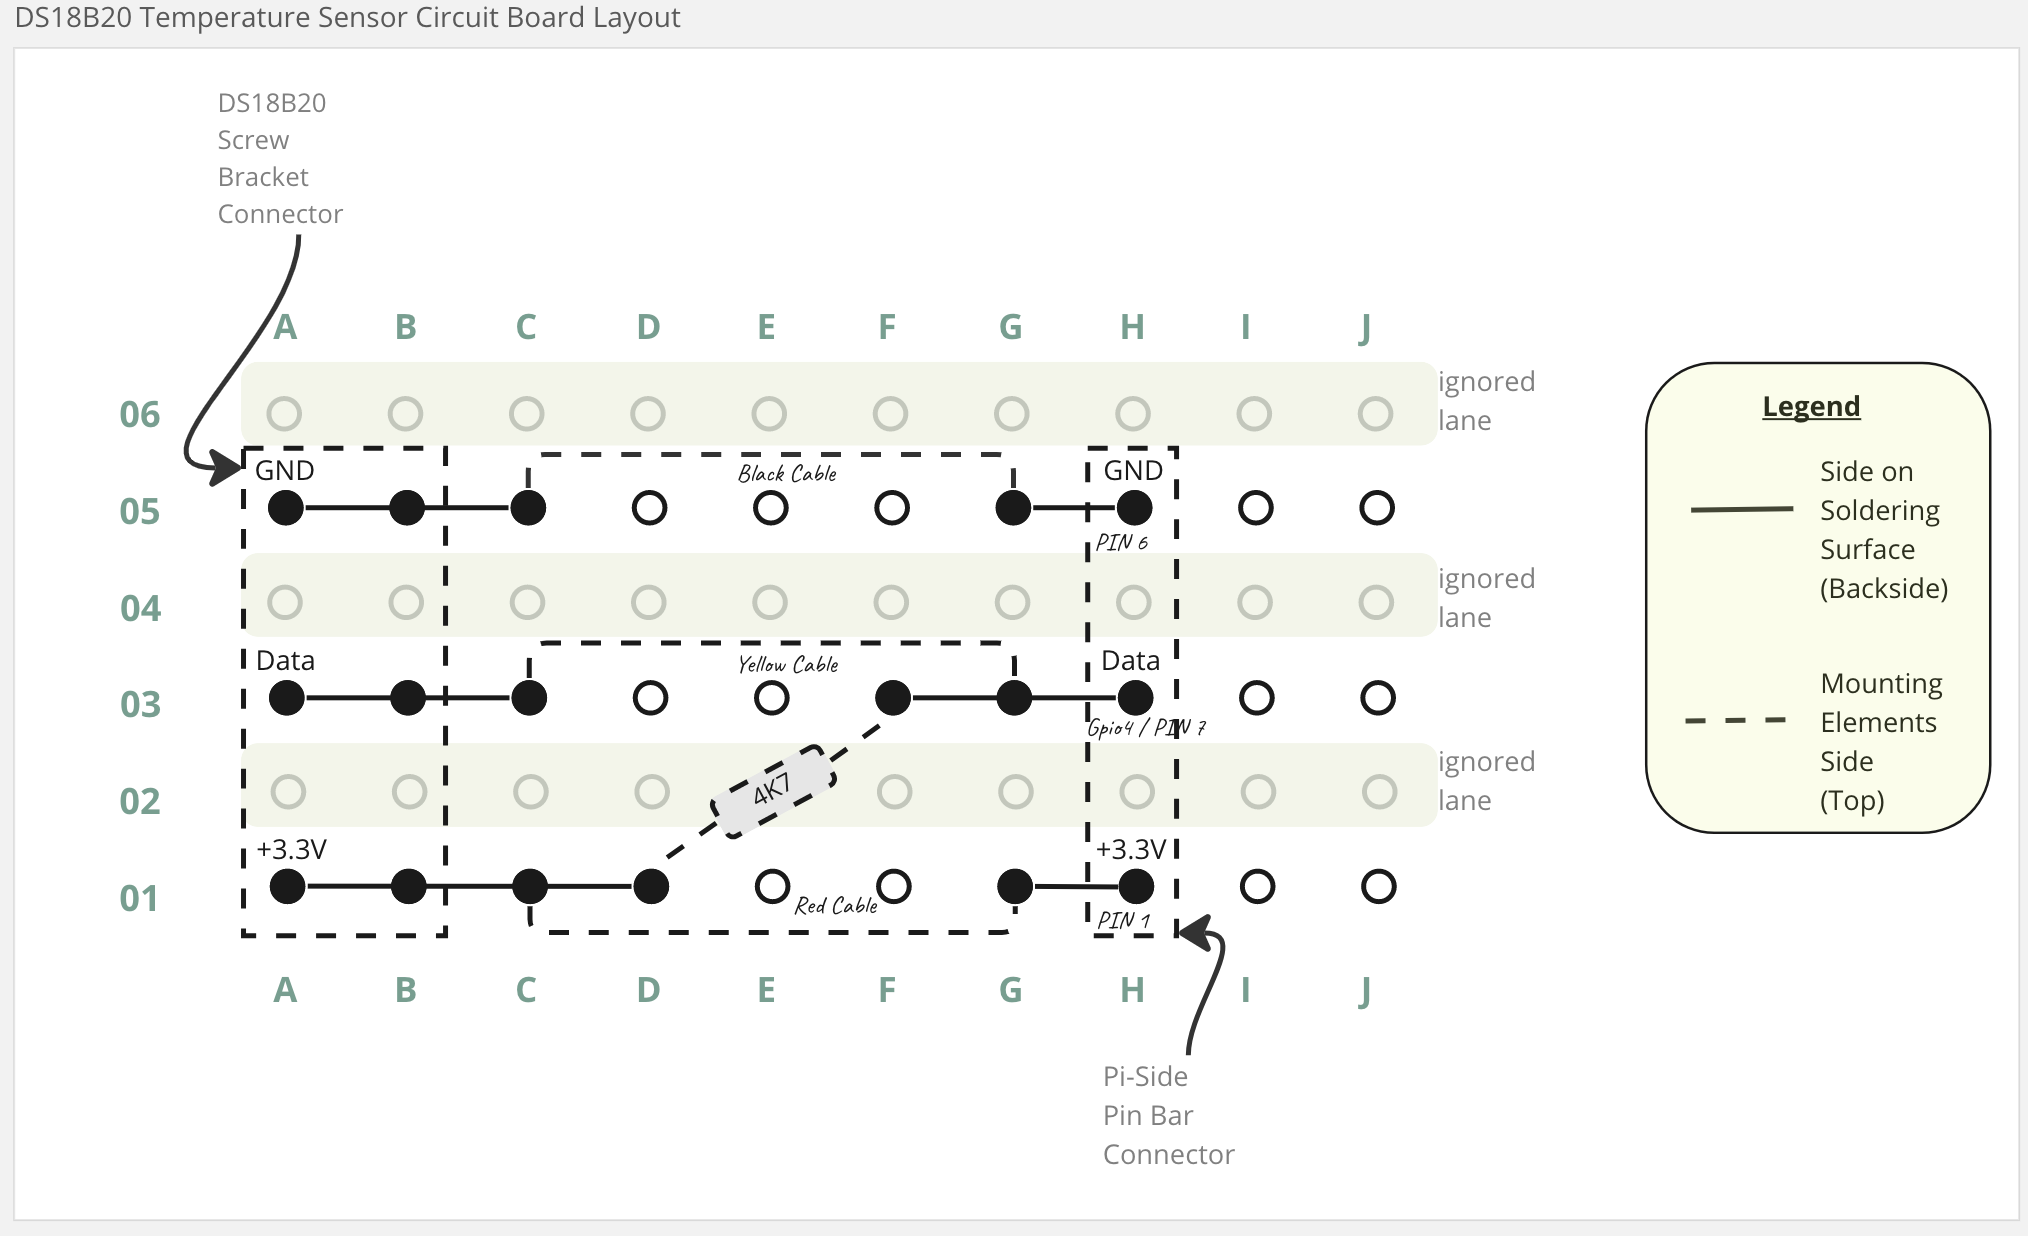
I built the pi DS18B20 circuit board layout following the wiring schema as seen from the tutorial here: http://tuxgraphics.org/npa/raspberry-pi-ds18s20-temperature-sensor/ The test readout from the tutoral mentioned above should be working before continuing.
Above tutorial uses some perl programming, which seems quite effective. Being familiar with java I chosed to write a small java microservice using spring-boot.
Tell your microservice which file to use to access your sensor
Notice the file exists twice
ansible/application.properties is the one which will be used on the pi while src/main/resources/application.properties will be taken on local deployment in you IDE.
# Each sensor has it's own device ID. You will find it as sub-folder here: /sys/bus/w1/devices
ds18b20.device.id=28-0319a2795781
curl http://localhost:8080/sensor/temp/ds18b20

# Temperature in celsius (will be exact 0.0 in case of errors)
aqua_measure_celsius{sensor="28-0319a2795781"} 21.062
# duration of measurement in millis
aqua_measure_duration{sensor="28-0319a2795781"} 3
That's it :-)
Setting up of Prometheus/Grafana is not covered in this project. I assume you have it already up and running, you may find my config helpful for integration. As the temperature won't change so fast, a scrape interval of 5 mins should be sufficient.
  # Atlantis aquametrics
  - job_name: 'aquametrics'
    metrics_path: '/sensor/temp/ds18b20'
    scrape_interval: 300s
    static_configs:
      - targets: ['atlantis:8080']
        labels:
          sensor: 'ds18b20'
Simple copy paste this as json export to got a simple dashboard for the sensor: assets/grafanaBoard.json
For those who do participate in the SABI-Project (see https://sabi-project.net on ipv6 networks | project description: https://github.com/StefanSchubert/sabi#readme )
you can connect your raspi to your SABI account, by just generating and API key from your tank editor:
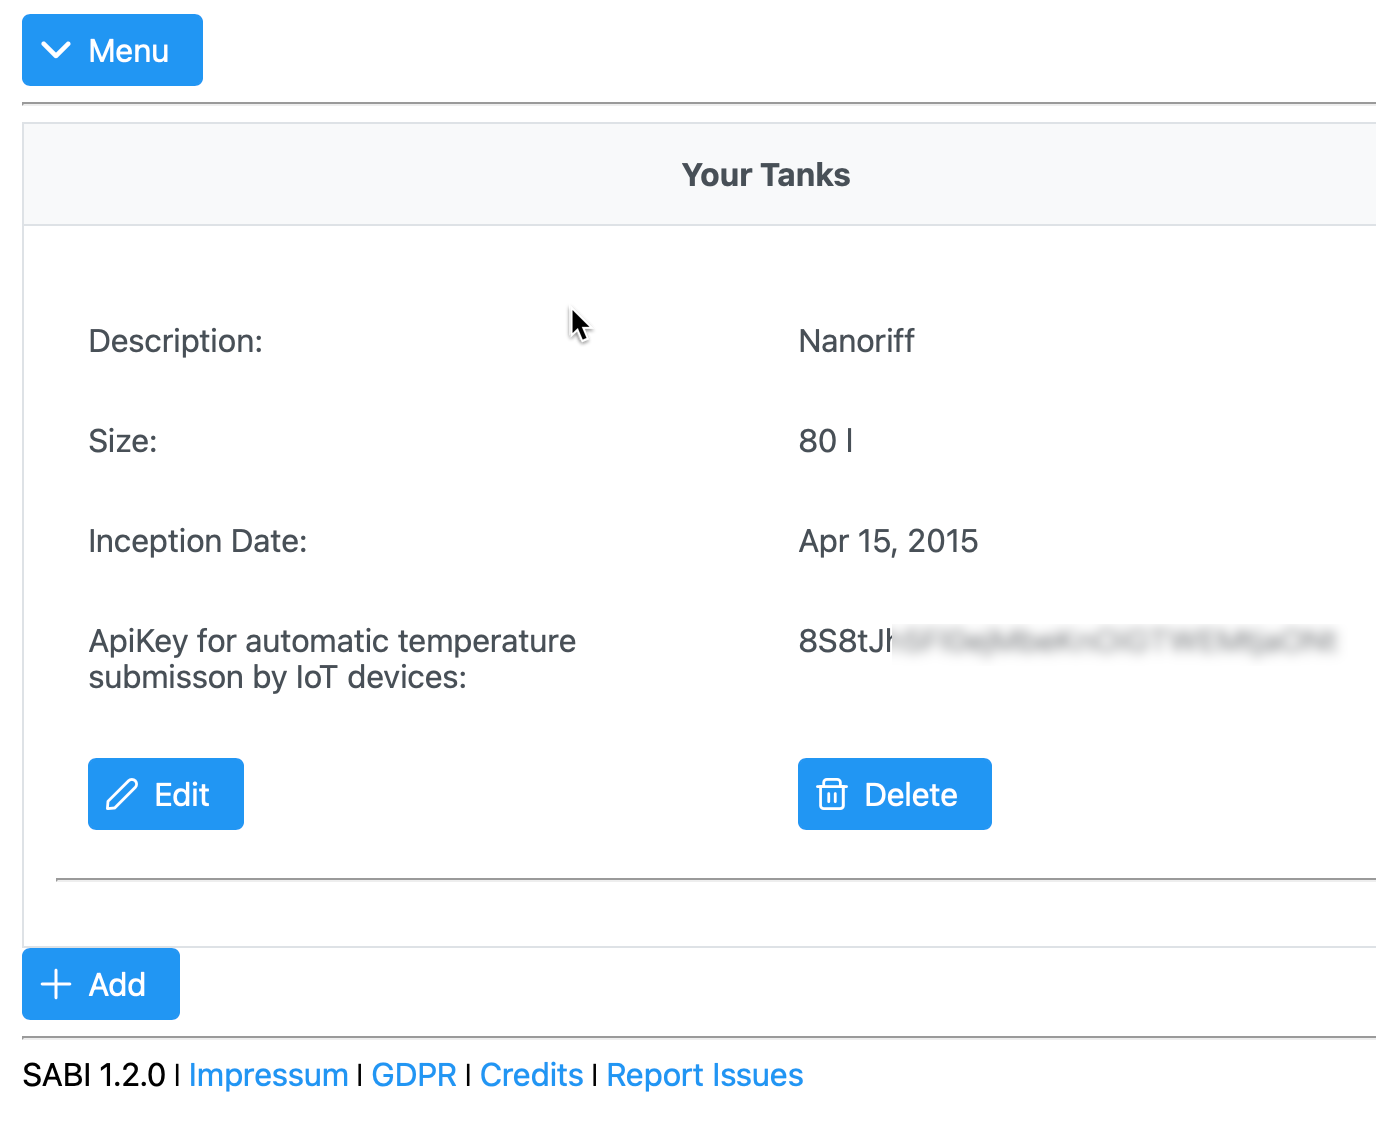
and add that key in your ansible/application.properties (see configuration below)
# Integration to SABI
# PRECONDITION: Sabi is only available within ipv6, so your pi and isp should have ipv6 connectivity
# The temperature readout will be submitted to a SABI REST endpoint
# Your require to have a login in SABI and to create an API-Key from your tank listing
# paste your API KEY in here. Your may also want to configure the report rate
# Notice that SABI accepts measurements only if at least one hour to last report have been past.
sabi.support.enabled=false
sabi.tank.temperature.api-key=<YOUR API KEY>
# every x hours (absolute values required no fraction / default is 4 hours)
sabi.tank.temperature.reportrate=1
sabi.temperature.api.endpoint=https://api.sabi-project.net/sabi/api/aquarium_iot/temp_measurement
That way you have your measurements not only in your local grafana/prometheus setup, but also shared/visible in the SABI-Project: