4. IPO Markets
In a nutshell, investment is important inorder to shield ourselves from inflation and generate wealth.
We can invest in any of the following asset classes :
- Fixed income instruments
These are investable instruments with very limited risk to the principle and the return is paid as an interest to the investor based on the particular fixed-income instrument.At the end of the term of deposit, (also known as maturity period) the capital is returned to the investor. Bonds and Fixed Deposits are Fixed income instruments. Interest varies around 8% to 11%.
- Equity
Investment in Equities involves buying shares of publicly listed companies. The shares are traded both on the Bombay Stock Exchange (BSE), and the National Stock Exchange (NSE). There is no capital guarantee here. The returns are higher and tax is also low.
- Real estate
Real Estate Investment involves transacting (buying and selling) commercial and non-commercial land. Typical examples would include transacting in sites, apartments and commercial buildings. There are two sources of income from real estate investments namely – Rental income, and Capital appreciation of the investment amount.
The transaction procedure can be quite complex involving legal verification of documents. The cash outlay in real estate investment is usually quite large.
- Commodities (precious metals)
Investments in gold and silver are considered one of the most popular investment avenues. Gold and silver over a long-term period have appreciated in value. Investments in these metals have yielded a CAGR return of approximately 8% over the last 20 years. There are several ways to invest in gold and silver. One can choose to invest in the form of jewelry or Exchange Traded Funds (ETF).
Investments optimally should have a strong mix of all asset classes. It is smart to diversify your investment among the various asset classes. The technique of allocating money across assets classes is termed as ‘Asset Allocation’.
- Higher the risk, higher the return. Lower the risk, lower is the return.
- Principal amount is protected in fixed income investments and is relatively less risky. However, you have the risk of losing money when you adjust the return for inflation.
- Investment in Equities is known to beat inflation and has generated returns close to 14-15% in the past. However, equity investments can be risky
- Real Estate investment requires a large outlay of cash and cannot be done with smaller amounts. Liquidity is another issue with real estate investment – you cannot buy or sell whenever you want. You always have to wait for the right time and the right buyer or seller to transact with you.
- Gold and silver are known to be a relatively safer but the historical return on such investment has not been very encouraging.
The stock market is where everyone who wants to transact in shares goes to. The main purpose of the stock market is to help you facilitate your transactions. You can access the stock market via a registered intermediary called the stockbroker.
There are two main stock exchanges in India that make up the stock markets. They are the Bombay Stock Exchange (BSE) and the National Stock Exchange (NSE). Besides these two exchanges, there are a bunch of other regional stock exchanges which don’t play any meaningful role anymore.
When money is involved, human emotions in the form of greed and fear run high. One can easily fall prey to these emotions and get involved in unfair practices. Given this, the stock markets need someone who can set the rules of the game (commonly referred to as regulation and compliance) and ensure that people adhere to these regulations and compliance thereby making the markets a level playing field for everyone.
In India the stock market regulator is called The Securities and Exchange Board of India often referred to as SEBI. The objective of SEBI is to promote the development of stock exchanges, protect the interest of retail investors, regulate the activities of market participants and financial intermediaries.
Points to note -
- When you buy shares these shares sit in your Depositary account usually referred to as the DEMAT account.
- When companies want to raise a loan they can issue debenture against which they promise to pay an interest. These debentures can be subscribed by public. Debentures give the company a way to get funds without diluting its equity. Interest to be paid on debentures is a charge against profit for the company. They also tend to be cheaper. Debenture holders bear very little risk since the loan is secured and the interest is payable even in the case of a loss to the company.
- If a company plans to raise money by floating an IPO, then merchant bankers are the ones who help companies with the IPO process.
Stock Broker is the gateway to stock exchanges. One needs to open a ‘Trading Account’ with a broker.
When you buy a share (a share represents part ownership in a company) the only way to claim your ownership is by producing your share certificate. A share certificate is nothing but a piece of document entitling you as the owner of the shares in a company. The storage place for the digital share certificate is the ‘DEMAT Account’. A Depository offers the service of the Demat account.
Banks help in facilitating the fund transfer from your bank account to your trading account.
NSCCL – National Security Clearing Corporation Ltd and Indian Clearing Corporation ensure guaranteed settlement of your trades/transactions. The clearing corporation also ensures there are no defaults by either party. For instance the seller after selling the shares should not be in a position to back out thereby defaulting in his transaction.
- Investors who place their trust in the entrepreneur and invest in pre-revenue stage are known as Angel investors. This initial investment used to start the business is called as 'The Seed Fund'.
- The money is placed in the company's bank account and is referred as the inital share capital of the company. The investors and entrepreneurs are issued with share certificates which entitles them as the owners of the company.
- Face value is the value of each share and it depends on the valuation of company and no. of shares.
- Face value is the value of share on which company calculates & pay dividend & other benefits to the shareholders. Issue price is the price at which shares has been issued in secondary market.
- Authorised shares refer to the maximum number of shares that a corporation is legally permitted to issue.
- The alloted portion of shares is called as issued shares. The shares which are authorised but not alloted remain with the company.
- The investor who invests in an early stage of business is called 'Venture Capitalist (VC)' and the money that the business gets at this stage is called Series A funding.
- Suppose the valuation of the company is 5cr. If a VC agrees to invest 7cr for 14% stake at the company, then the VC estimates the company's valuation to be 50cr.
- Whenever a company plans such expenditure to improve the overall business, the expenditure is called 'Capital Expenditure’ or simply ‘CAPEX’. It can fund the CAPEX requirements through,
- Profits, called as funding through internal accruals
- Another round of VC funding by allotting shares from the authorized capital – this is called Series B funding
- a loan is also called ‘Debt’ from a bank
- Raising money through debt has interest rate burden, also called the finance charges which would eat away the profits the company generates.
- VC funding is usually small and runs into a few crores.Private Equity(PE) investors invest large amounts of money with the objective of not only providing the capital for constructive use but also place their own people on the board of the investee company to ensure the company steers in the required direction.
- When a company files for an IPO, they have to offer their shares to the general public. The general public will subscribe to the shares (if they want to) by paying a certain price. If the company is offering the shares for the first time to the public, it is called the “Initial Public Offer’.
- Fund required for CAPEX is raised.
- All share holders share the same amount of risk. Through public offering, the risk is spread among a large number of people.
- The existing shareholders can sell their shares to the public and exit the company.
- Shares can be allotted to employees as an incentive.
- Trading publicly increases the visibility of the company, thereby impacting in positive growth.
- There is no interest repayment like in debt and company can raise large funds.
Merchant bankers are also called Book Running Lead Managers (BRLM)/Lead Manager (LM). The job of a merchant banker is to assist the company with various aspects of the IPO process including:
-
Conduct due diligence on the company filing for an IPO, ensure their legal compliance and also issue a due diligence certificate
-
Should work closely with the company and prepare their listing documents including Draft Red Herring Prospectus (DRHP) - This is a pre-eliminary registration document or prospectus. A DRHP should contain the following details:
- The estimated size of the IPO
- The estimated number of shares being offered to the public
- Why the company wants to go public and how does the company plan to utilize the funds along with the timeline projection of fund utilization
- Business description including the revenue model, expenditure details
- Complete financial statements
- Management Discussion and Analysis – how the company perceives future business operations to emerge
- Risks involved in the business
- Management details and their background
-
Underwrite shares – By underwriting shares, merchant bankers essentially agree to buy all or part of the IPO shares and resell the same to the public
-
Help the company arrive at the price band for the IPO. A price band is the lower and upper limit of the share price within which the company will go public. The price band is usually higher than the actual than the actual value of shares.
-
Help the company with promotional/marketing activity for the company’s IPO
-
Appointment of other intermediaries namely, registrars, bankers, advertising agencies, etc. The Lead manager also makes various marketing strategies for the issue
During the bidding process (also called the date of issue) investors can bid for shares at a particular price within the specified price band. This whole system around the date of the issue where one bids for shares, is referred to as the Primary Market. The moment the stock gets listed and debuts on the stock exchange, the stock starts to trade publicly. This is called the secondary market.
Once the stock transitions from primary markets to secondary markets, the stock gets traded daily on the stock exchange. People start buying and selling stocks regularly.
The stock market is a place where market participants can access any publicly listed company and trade from their point of view, as long as there are other participants who have an opposing point of view.
The basic principle of a stock price goes like this - If the company is expected to do well (valuation of company will increase) then the trader will buy those stocks and he/she will sell them in the other case.If the company is expected to do well then traders will buy stocks for higher prices too and the stock prices go up
You have to visit a broker to trade. Suppose you are buying stocks, you convey the same to the broker. Before your broker transmits this order to the exchange he needs to ensure you have sufficient money to buy these shares. If yes, then this order ticket hits the stock exchange. Once the order hits the market the stock exchange (through their order matching algorithm) tries to find a seller who is willing to sell you.Once the trade is executed, the shares will be electronically credited to your DEMAT account. Likewise the shares will be electronically debited from the sellers DEMAT account.
- By virtue of owning the shares you are entitled to few corporate benefits like dividends, stock split, bonus, rights issue, voting rights etc. We will explore all these shareholder privileges at a later stage.
- Holding period is defined as the period during which you intend to hold the stock.
- Returns are calculated as Absolute returns and Compound Annual Growth Returns(CAGR).
An index acts as a barometer of the whole economy.An index going up (down) indicates that the market participants are optimistic (pessimistic).
There are two main market indices in India. The S&P BSE Sensex representing the Bombay stock exchange and CNX Nifty representing the National Stock exchange.
- The index reflects the general market trend for a period of time. The index is a broad representation of the country’s state of the economy.
- A trader can compare his/her returns to the returns of the indices and conclude if he/she has underperformed/overperformed the index.
- One can trade on the index in the from of derivatives - futures and options.
Index is a composition of many stocks from different sectors which collectively represents the state of the economy. To include a stock in the index it should qualify certain criteria. Each index stock is given a weightage which represents the contribution to movement of index. Indian stock exchange follows a method called free-float market capitalization. The weights are assigned based on the free-float market capitalization of the company, the larger the market capitalization, the higher is the weight.
Free float market capitalization is the product of the total number of shares outstanding in the market, and the price of the stock.
There are sector-specific indices which convey the sentiment of specific sectors.
- Bull Market (Bullish) – If you believe that the stock prices are likely to go up then you are said to be bullish on the stock price. From a broader perspective, if the stock market index is going up during a particular time period, then it is referred to as the bull market.
- Bear Market (Bearish) – If you believe that the stock prices are likely to go down then you are said to be bearish on the stock price.
- Trend – Refers to the general market direction, and its associated strength.
- Face value of a stock – Face value (FV) or par value of a stock indicates the fixed denomination of a share. The face value is important with regard to a corporate action. It is nothing but the nominal value of the share so fixed by the company in the beginning. It is the value at which the company registers itself initially. It won’t change daily with the market forces.
- 52 week high/low – 52 week high is the highest point at which a stock has traded during the last 52 weeks (which also marks a year) and similarly for 52 week low.
- Upper Circuit/Lower Circuit – The exchange sets up a price band at which the stock can be traded in the market on a given trading day. The highest price the stock can reach on the day is the upper circuit limit and the lowest price is the lower circuit limit. The limit for a stock is set to 2%, 5%, 10% or 20% based on the exchange’s selection criteria. The exchange places these restrictions to control excessive volatility when a stock reacts to certain news related to the company.
- Long Position - If you are long on a stock or an index, you are said to be bullish.
- Short Position - When you short, you have a bearish view on the stock. You profit if the stock price goes down. When you short you essentially borrow from another market participant, and you will have to deliver these shares back. You sell and then buy.
- Square off – Term used to indicate that you intend to close an existing position. If you are long on a stock squaring off the position means to sell the stock. Please remember, when you are selling the stock to close an existing long position you are not shorting the stock! When you are short on the stock, squaring off a position means to buy the stock back. Remember when you buy it back, you are just closing an existing position and you are not going long!
- OHLC – OHLC stands for open, high, low and close.
- Volume - Volumes represent the total transactions (both buy and sell put together) for a particular stock on a particular day.
- Market Segment – A market segment is a division within which a certain type of financial instrument is traded.The exchange operates in three main segments.
- Capital Market – Offers a wide range of tradable securities such as equity, preference shares, warrants, and exchange-traded funds. Capital Market segment has sub-segments under which instruments are further classified. For example, common shares of companies are traded under the equity segment abbreviated as EQ. So if you were to buy or sell shares of a company you are essentially operating in the capital market segment
- Futures and Options – Futures and Option, generally referred to as the equity derivative segment is where one would trade leveraged products.
- Wholesale Debt Market – The wholesale debt market deals with fixed income securities. Debt instruments include government securities, treasury bills, bonds issued by a public sector undertaking, corporate bonds, corporate debentures, etc.
- The last traded price of the stock (LTP) – This gives us a sense of how much the stock is trading at the very moment
- Percentage change – This indicates the percentage points the LTP is varying with respect to the previous day close
Buying Options -
- Limit Price - This is used to buy a stock at a fixed price given by the buyer. You can get these stocks if the stock price goes down to limit price.
- Market price - This is used to buy shares at market price. In this case, the buyer doesn't know the exact price he/she is transacting at.
- A stop-loss order protects you from an adverse movement in the market after initiating a position. That is, the share will be sold if the share price goes below the trigger price.
CNC when holding position is greater than days and NRML/MIS for intra-day positions.The bid & ask prices refer to the price at which you can transact. The buying process-
- The day you make the transaction is referred to as the trade date, represented as ‘T Day’.(the price includes brokerage charges)
- The day after you made the transaction is called the T+1 day. On T+1 day you can sell the stock that you purchased the previous day. The shares are not in your DEMAT account yet.( Hence, can be risky)
- On T+2 day, the seller is credited with your money and you acquire the shares in your DEMAT account.
- Dividends
Dividends are paid by the company to its shareholders. Dividends are paid to distribute the profits made by the company during the year(need not be from profits alone). Dividends are paid on a per-share basis. It is not mandatory to pay out dividends every year.Only shareholders who own the shares before the ex-dividend date are entitled to the dividend. After the ex-dividend date, the share prices get reduced by to the extent of the dividend. This can be explained in 2 ways -
- Once the dividend is paid, the assets and shareholders equity get reduced by that extent.
- On payment of dividend, the buyers will know that the value of the company has gone down by the value of dividend per share. Hence, the buyer will buy shares for a lesser price.
- Bonus Issue
A bonus issue is a stock dividend issued out of the reserves of the company. These are free shares that the shareholders receive against shares that they currently hold. If the ratio is 2:1 ratio, the existing shareholders get 2 additional shares for every 1 share they hold. The value of each share reduces in the ratio of Bonus Issue.
- Stock Split
Each stock is split in a certain ratio to reduce share price and encourage retail participation.
- Rights Issue
Inorder to raise funds, the company offers the existing shareholders to buy more shares at a lower price. An existing shareholder may subscribe to this is he/she believes in the future of the company. The share price may decrease after this action.
- Buyback of Shares
A buyback can be seen as a method for a company to invest in itself by buying shares from other investors in the market. Buybacks reduce the number of shares outstanding in the market.This usually results in increase in share price. There could be many reasons why corporates choose to buy back shares
- To prove the profitability on a per-share basis
- To consolidate their stake in the company
- To prevent other companies from taking over
- To show the confidence of the promoters about their company
- To support the share price from declining in the markets
-
Monetary Policy - While setting the interest rates the RBI has to strike a balance between growth and inflation. In a nutshell – if the interest rates are high that means the borrowing rates are high (particularly for corporations). If corporate can’t borrow easily they cannot grow. If corporations don’t grow, the economy slows down.On the other hand, when the interest rates are low, borrowing becomes easier. This translates to more money in the hands of corporations and consumers. With more money, there is increased spending which means the sellers tend to increase prices leading to inflation.
Repo Rate – Whenever banks want to borrow money they can borrow from the RBI. The rate at which RBI lends money to other banks is called the repo rate.
Reverse repo rate – Reverse Repo rate is the rate at which RBI borrows money from banks.The RBI meets every two months to review the rates. This is a key event that the market watches out for. The first to react to rate decisions would be interest-rate sensitive stocks across various sectors such as – banks, automobile, housing finance, real estate, metals, etc.
-
Inflation - Inflation is a sustained increase in the general prices of goods and services.
There are two types of inflation indices – Wholesale Price Index (WPI) and Consumer Price Index (CPI). Usually, a low-interest rate tends to increase inflation and a high-interest rate tends to arrest inflation. -
Index of Industrial Production (IIP) - The Index of Industrial Production (IIP) is a short term indicator of how the industrial sector in the country is progressing. The data is released every month (along with inflation data) by the Ministry of Statistics and Programme Implementation (MOSPI).If the IIP is increasing it indicates a vibrant industrial environment (as the production is going up) and hence a positive sign for the economy and markets. A decreasing IIP indicates a sluggish production environment, hence a negative sign for the economy and markets.
-
Purchasing Managers Index (PMI) - The Purchasing managers’ index (PMI) is an economic indicator that tries to capture the business activity across the manufacturing and service sectors in the country. Increase means expansion of business.
-
Budget - A Budget is an event during which the Ministry of Finance discusses the country’s finance in detail. During the budget presentation, major policy announcements and economic reforms are announced which has an impact on various industries across the markets. Therefore the budget plays a very important role in the economy. For ex, if tax rates on a particular product are increased, then the profits of the product manufacturing company may come down. Hence, its share price comes down and its weightage as an index stock will decrease.Budget is an annual event and it is announced during the last week of February. The volatility of market greatly increases before budget presentation.
-
Corporate Earnings Announcement - The listed companies (trading on stock exchange) are required to declare their earning numbers once in every quarter, also called the quarterly earnings numbers. During an earnings announcement, the corporate gives out details on various operational activities including the revenue generated, expense management, amount of money paid as taxes and interests and profitability.
The market participant’s expectation is called the ‘street expectation’. The stock price will react positively if the company’s earnings are better than the street expectation.
Moneyness of an option is a classification method which classifies each option strike based on how much money a trader is likely to make if he were to exercise his option contract today.
There are 3 broad classifications –
- In the Money (ITM)
- At the Money (ATM)
- Out of the Money (OTM)
If the intrinsic value is a non zero number, then the option strike is considered ‘In the money’. If the intrinsic value is a zero the option strike is called ‘Out of the money’. The strike which is closest to the Spot price is called ‘At the money’. In general, ITM options are always more expensive compared to OTM options.
It is a statistical measure of the dispersion of returns for a given security or market index. Volatility can either be measured by using the standard deviation or variance between returns from that same security or market index. Commonly higher the standard deviation, higher is the risk.
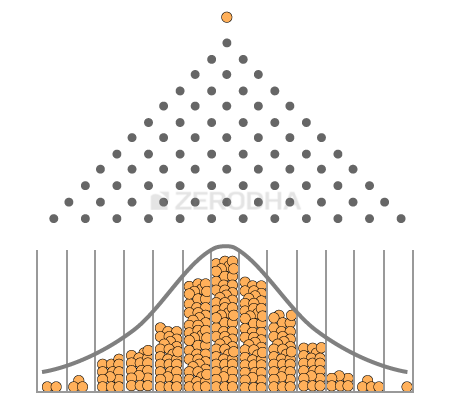
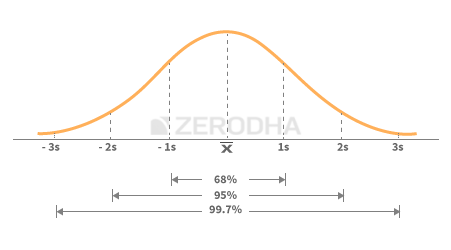
The daily returns of a stock or an index cannot be predicted.However if I collect the daily returns of the stock for a certain period and see the distribution of these returns – I get to see a normal(Gaussian) distribution.
The premium of the option depends on certain forces called as the ‘OptionGreeks’. Crudely put, some Option Greeks tends to increase the premium, whilesome try to reduce the premium. Though all these factors work as independent agents, yet they are all intervened with one another. A formula called the ‘Black & Scholes Option Pricing Formula’ employs these forces and translates the forces into a number, which is the premium of the option.
These are the Option Greeks:
- Delta – Measures the rate of change of options premium based on the directional movement of the underlying
- Gamma – Rate of change of delta itself
- Vega – Rate of change of premium based on change in volatility
- Theta – Measures the impact on premium based on time left for expiry
The Delta measures how an options value changes with respect to the change in the underlying. i.e; Delta is the rate of change of Premium with respect to Underlying.
The delta is a number which varies –
- Between 0 and 1 for a call option, some traders prefer to use the 0 to 100 scale. So the delta value of 0.55 on 0 to 1 scale is equivalent to 55 on the 0 to 100 scale.
- Between -1 and 0 (-100 to 0) for a put option. So the delta value of -0.4 on the -1 to 0 scale is equivalent to -40 on the -100 to 0 scale.
Note-
- The delta value cannot be greater than 1. If that is the case, the change in value of premium will be more than that of underlying stock which is codswallop. Option is derived from its underlying and it can never move faster than the underlying itself.
- The delta value cannot be less than 0 as there is a chance that premium becomes negative because of negative delta.
The delta changes with changes in the value of spot. Hence delta is a variable and not really a fixed entity. Therefore if an option has a delta of 0.4, the value is likely to change with the change in the value of the underlying. It's relation can represented through the following graph :-
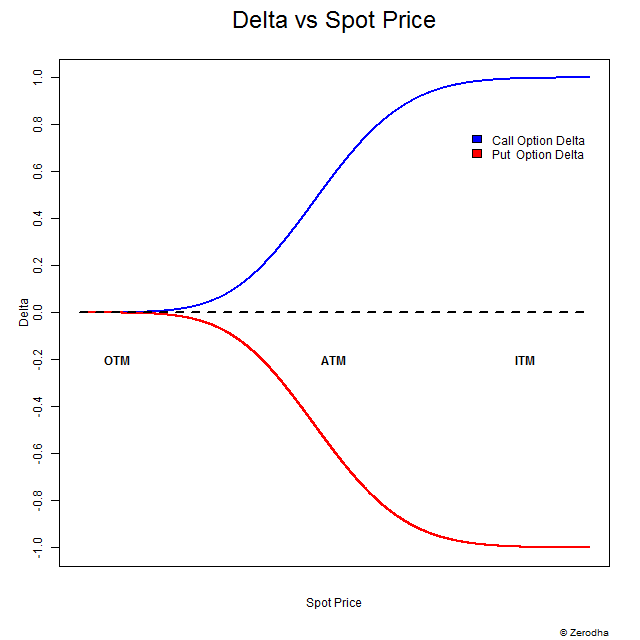
Note the following points about the above graph (written with respect to call option but similar observations can be made for put option) -
- The delta value increases as spot value increases
- Delta doesn't change much when monyness is deep OTM or OTM ( similarily with deep ITM and ITM).
- Delta hits 0.5 at ATM.
We can conclude the following (written for call options)-
- Deep OTM options tends to put on an impressive percentage however for this to happen the spot has to move by a large value.
The change in premium is proportional to change in underlying (by a factor of delta). The premiums are low for OTM options hence a meaningful change in underlying can give massive yields of premium in terms of percentages.
- The slightly OTM option which usually has a delta value of say 0.2 or 0.3 is more sensitive to changes in the underlying. For any meaningful change in the underlying the percentage change in the slightly OTM options is very impressive.
The delta is higher than deep OTM options hence less risk and more returns. The risk is lower because if the spot price decreases the delta value remains almost same (curve is flatter and change is low) and the returns are more because if spot price increases the delta value increases rapidly (acceleration stage). In a vague manner, we are talking about f"(x) and not f'(x). We can say that the premium vs spot price curve looks like an exponential curve here. Note that the premiums are higher in case of OTM options when compared to deep OTM ones.
- ATM options are more sensitive to changes in the spot when compared to OTM options. Now because the ATM’s delta is high the underlying need not really move by a large value. Even if the underlying moves by a small value the option premium changes. However buying ATM options are more expensive when compared to OTM options.
The percentage yields are lower because the premium also increased rapidly when compared to OTM options.
- In terms of the absolute change in the number of points, the deep ITM option scores over the slightly ITM option. However in terms of percentage change it is the other way round. Clearly ITM options are more sensitive to the changes in the underlying but certainly most expensive.
The risk is lowest in ITM options. When delta is 1 (deep ITM), buying a deep ITM option is as good as buying the underlying itself. This is because whatever is the change in the underlying, the deep ITM option will experience the same change. Deep ITM option moves in line with the underlying, this means you can substitute a deep ITM option to a futures contract (lesser margin though).
The above can be summarised as follows - The price is 2210 and the expectation is a 30 point change in the underlying (which means we are expecting spot price to hit 2240). We will also assume there is plenty of time to expiry; hence time is not really a concern.
| Moneyness | Strike | Delta | Old Premium | Change in Premium | New Premium | % Change |
|---|---|---|---|---|---|---|
| Deep OTM | 2400 | 0.05 | Rs.3/- | 30* 0.05 = 1.5 | 3+1.5 = 4.5 | 50% |
| Slightly OTM | 2275 | 0.3 | Rs.7/- | 30*0.3 = 9 | 7 +9 = 16 | 129% |
| ATM | 2210 | 0.5 | Rs.12/- | 30*0.5 = 15 | 12+15 = 27 | 125% |
| Slightly ITM | 2200 | 0.7 | Rs.22/- | 30*0.7 = 21 | 22+21 = 43 | 95.45% |
| Deep ITM | 2150 | 1 | Rs.75/- | 30*1 = 30 | 75 + 30 =105 | 40% |
- Deltas of the call and puts can be added as long as it belongs to the same underlying.
- Positions such as this – which have a combined delta of 0 are also called ‘Delta Neutral’ positions. Delta Neutral positions do not get impacted by any directional change. They behave as if they are insulated to the market movements.However, Delta neutral positions react to other variables like Volatility and Time.
- This technique of adding up the deltas is very helpful when you have multiple option positions running simultaneously and you want to identify the overall directional impact on the positions.
- Futures contract is only affected by the direction of the market, however the options contracts are affected by many other variables besides the direction of the markets.
- Delta also represents the probability of the moneyness to change to favourable conditions. As in, if the delta of an OTM option is 0.3, then the probability that this Option turns into an ITM before expiry is 30%.
If delta is considered as velocity then gamma is acceleration. Premium can be considered as distance. Gamma is also referred to as the curvature of option. The gamma is usually expressed in deltas gained or lost per one point change in the underlying – with the delta increasing by the amount of the gamma when the underlying rises and falling by the amount of the gamma when the underlying falls.
- The change in Gamma due to changes in underlying is captured by 3rd derivative of underlying called “Speed” or “Gamma of Gamma” or “DgammaDspot”. For all practical purposes, it is not necessary to get into the discussion of Speed.
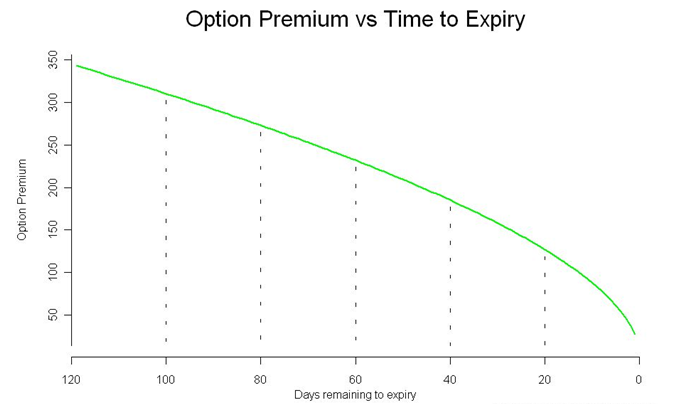
Premium = Time value + Intrinsic Value
All other things being equal, an option is a depreciating asset. The option’s premium erodes daily and this is attributable to the passage of time. approaches. The Theta or time decay factor is the rate at which an option loses value as time passes. Theta is expressed in points lost per day when all other conditions remain the same.
Theta is a friendly Greek to the option seller. Remember the objective of the option seller is to retain the premium. Given that options lose value on a daily basis, the option seller can benefit by retaining the premium to the extent it loses value owing to time.
The Vega of an option measures the rate of change of option’s value (premium) with every percentage change in volatility. With increase in volatility, the Vega of an option increases (irrespective of calls and puts), and with increase in Vega, the option premium tends to increase. The effect of Vega is particularly high for ‘Out of the money’ options.
The following points should be noted while using technical analysis:
- Trades – TA is best used to identify short term trades. Do not use TA to identify long term investment opportunities. Long term investment opportunities are best identified using fundamental analysis. Also, If you are a fundamental analyst, use TA to calibrate the entry and exit points.
- Return per trade – TA based trades are usually short term in nature. Do not expect huge returns within a short duration of time. The trick with being successful with TA is to identify frequent short term trading opportunities which can give you small but consistent profits.
- Holding Period – Trades based on technical analysis can last anywhere between few minutes and few weeks, and usually not beyond that.
- Risk – Often traders initiate a trade for a certain reason, however in case of an adverse movement in the stock, the trade starts making a loss. Usually in such situations, traders hold on to their loss making trade with a hope they can recover the loss.
- Markets discount everything – This assumption tells us that, all known and unknown information in the public domain is reflected in the latest stock price. For example there could be an insider in the company buying the company’s stock in large quantity in anticipation of a good quarterly earnings announcement. While he does this secretively, the price reacts to his actions thus revealing to the technical analyst that this could be a good buy.
- The ‘how’ is more important than ‘why’ – This is an extension to the first assumption. Going with the same example as discussed above – the technical analyst would not be interested in questioning why the insider bought the stock as long he knows how the price reacted to the insider’s action.
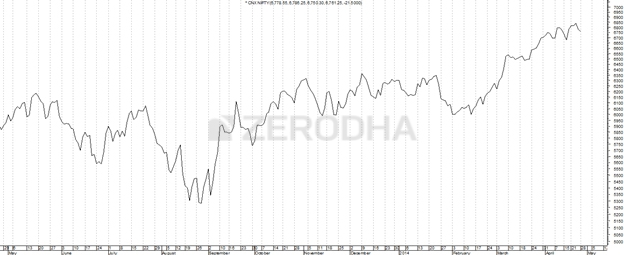
- Price moves in trend – All major moves in the market is an outcome of a trend. The concept of trend is the foundation of technical analysis. For example the recent upward movement in the NIFTY Index to 7700 from 6400 did not happen overnight. This move happened in a phased manner, in over 11 months. Another way to look at it is, once the trend is established, the price moves in the direction of the trend.
- History tends to repeat itself – In the technical analysis context, the price trend tends to repeat itself. This happens because the market participants consistently react to price movements in a remarkably similar way, each and every time the price moves in a certain direction. For example in up trending markets, market participants get greedy and want to buy irrespective of the high price. Likewise in a down trend, market participants want to sell irrespective of the low and unattractive prices. This human reaction ensures that the price history repeats itself.
The advantage of the line chart is its simplicity. With one glance, the trader can identify the generic trend of the security. However the disadvantage of the line chart is also its simplicity. Besides giving the analysts a view on the trend, the line chart does not provide any additional detail. Plus the line chart takes into consideration only the closing prices ignoring the open, high and low.
Example of line chart :
The bar chart consists of vertical lines which span the low and high of the day and two horizontal lines - left horizontal line represents the day's open and the right one represents the day's close. Example of a bar chart:
The Japanese Candlesticks have a central thick body spanning from close to open (if close is greater than open then it is called a bullish candle and bearish candle otherwise) and a shadow(thin line) spanning from low to high.
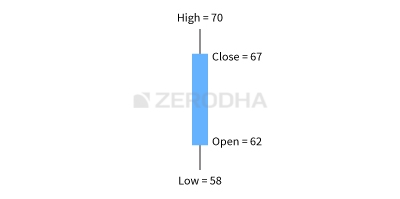
This is how a candlestick chart looks like -
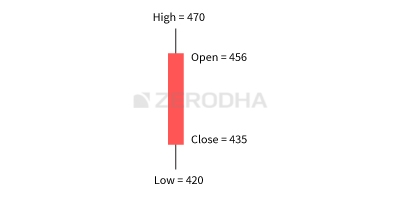
A long bodied candle depicts strong buying or selling activity. A short bodied candle depicts less trading activity and hence less price movement.
The following assumptions should be kept in mind:
- Buy strength and sell weakness – Strength is represented by a bullish (blue) candle and weakness by a bearish (red) candle. Hence whenever you are buying ensure it is a blue candle day and whenever you are selling, ensure it’s a red candle day.
- Be flexible with patterns (quantify and verify) – While the text book definition of a pattern could state a certain criteria, there could be minor variations to the pattern owing to market conditions. So one needs to be a bit flexible. However one needs to be flexible within limits, and hence it is required to always quantify the flexibility.
- Look for a prior trend – If you are looking at a bullish pattern, the prior trend should be bearish and likewise if you are looking for a bearish pattern, the prior trend should be bullish.
Gap up opening – A gap up opening indicates buyer’s enthusiasm. Buyers are willing to buy stocks at a price higher than the previous day’s close. Hence, because of enthusiastic buyer’s outlook, the stock (or the index) opens directly above the previous day’s close.
Gap down opening – Similar to gap up opening, a gap down opening shows the enthusiasm of the bears. The bears are so eager to sell, that they are willing to sell at a price lower than the previous day’s close.
A Marubozu ('bald' in Japanese) has negligible upper and lower shadows. It can appear anywhere on the chart without any specific prior trend. Bullish Marubozu -
Thoughts: Buyers are strongly bullish and have bought shares at every price. This trend is expected to continue.
Recommended Actions: Look for buying opportunities. The buy price should be around the closing price of Marubozu. The stop loss can be set to low of Marubozu. It is not recommended to trade on extremely short or long candles.
A Spinning top has a short body and almost equal upper and lower shadows.
Thoughts: The bulls and bears both tried to influence the market but their attempts were futile. It shows indecisiveness amongst both bulls and bears.
Spinning Tops in Downtrend:
Thoughts: The market may continue to be bearish or it may reverse ending up in bullish sessions with equal probability.
Recommended Actions: The trader needs to be prepared for both scenarios. They may place half of their investment for trading.
A Doji has negligible or nil body and there are no restrictions on the shadows. Explanations are similar to that of Spinning Top.
A paper umbrella is characterized by a long lower shadow(x2 body) with a small upper body. Hammer may have less risk compared to Hanging Man.
Appears after a downtrend
Thoughts: Bears were controlling the market until this pattern is seen. The bulls attempted to take control. A bullish trend may be seen in the following sessions.
Recommended Actions: Look for buying opportunities. The stop loss is the lowest point of the hammer.
Appears after an uptrend.
Thoughts: Bulls were in control of the market. Appearance of Hanging Man shows that the bears have entered the market.
Recommended Actions: A short can be initiated with high of the candle as stop loss.
It looks like an inverted Paper Umbrella. Prior trend should be Bullish.
Thoughts: Bulls were in control but Bears made a good attempt to control the markets. The bears are expecteed to control the market over the next trading sessions.
Recommended Actions: High of the body can be set to stop loss for a short trade.
In a typical engulfing pattern a small candle is followed by a relatively long candle which appears as if it (the body) engulfs the candle on day 1. If the engulfing pattern appears at the bottom of the trend, it is called the “Bullish Engulfing” pattern. If the engulfing pattern appears at the top end of the trend, it is called the “Bearish Engulfing” pattern.
Bullish Engulfing Pattern
The prior trend should be downtrend. The first candle must be bearish followed by a longer bullish candle. Can be relied upon in many situations.
Thoughts: The bears were in control of the market. Bulls successfully took over the market in the next trading session which is evident from the longer blue candle.
Recommended Actions: The buy price can be set to the close of the blue candle. A risk averse trader can set up trade after ensuring a blue candle is seen on the next day. The stop loss can be set to low of the two candles of the pattern.
Bearish Engulfing Pattern
Similar explanations as above.
- If a doji follows the engulfing candle then the opportunities are bigger. It shows indecisiveness after a panic session.
Piercing Pattern
Similar to Bullish Engulfing pattern but the second candle engulfs 50-100% of the first candle. Similar thought processes apply.
Dark Cloud Cover
It is the inverse of Piercing Pattern, i.e; It is similar to Bearish Engulfing Pattern.
- Typically stocks in the same sector have similar price movement. For example, think about TCS and Infosys or ICICI Bank and HDFC bank. Their price movement is similar because these companies are more or less of the same size, have similar business, and the same external factors that affect their business.
Harami is a two candle pattern. The first candle is usually long and the second candle has a small body. The second candle is generally opposite in colour to the first candle. On the appearance of the harami pattern a trend reversal is possible.
Bullish Harami
Appears after a down trend. A bearish candle is followed by a bullish candle. The opening on P2 should be higher than the close of P1.
Thoughts: On day 1 of the pattern (P1) a red candle with a new low is formed, reinforcing the
bear’s position in the market. On day 2 of the pattern (P2) the market opens at a price higher than the previous day’s close. On seeing a high opening price the bears panic ,as they would have otherwise expected a lower opening price. The blue candle not only encourages the bulls to build long positions, but also unnerves the bears.
Recommended Actions: Go for a long trade. The lowest low of the pattern will be the stoploss for the trade.
Bearish Harami
Appears after an uptrend. The open of P2 should be lower than the close of P1.
The morning star is a bullish candlestick pattern which evolves over a three day period. It is a downtrend reversal pattern. The pattern is formed by combining 3 consecutive candlesticks. The morning star appears at the bottom end of a down trend.
Thoughts: P1 establishes the influlence of bears over the market with a bearish candle. P2 opens with a gap down much to the joy of the bears. Although, P2 ends up becoming a spinning top or Doji showing indecision in the market. P3 opens with a gap up to the astonishment of bears. The candle must cross the open of the P1 candle.
Recommended Actions: Go for a long trade if current market price on P3 is higher than open of P1. The lowest low in the pattern would act as a stop loss for the trade.
The evening star is the bearish equivalent of Morning Star. Explanations are similar to above.
The best way to identify the target price is to identify the support and the resistance points. The support and resistance (S&R) are specific price points on a chart which are expected to attract the maximum amount of either buying or selling. The support price is a price at which one can expect more buyers than sellers. Likewise the resistance price is a price at which one can expect more sellers than buyers.
The resistance level is a price point on the chart where traders expect maximum supply (in terms of selling) for the stock/index. The resistance level is always above the current market price. The likely hood of the price rising up to the resistance level, consolidating, absorbing all the supply, and then declining is high. The resistance often acts as a trigger to sell.
The support level is a price point on the chart where the trader expects maximum demand (in terms of buying) coming into the stock/index. Whenever the price falls to the support line, it is likely to bounce back. The support level is always below the current market price.
- Identify at least 3 price action zones – A price action zone can be described as ‘sticky points’ on chart where the price has displayed at least one of the behaviors:
- Hesitated to move up further after a brief up move
- Hesitated to move down further after a brief down move
- Sharp reversals at particular price point
- Align the price action zones – When you look at a 12 month chart, it is common to spot many price action zones. But the trick is to identify at least 3 price action zones that are at the same price level.
- Fit a Horizontal line.
We need to prepare a checklist to improve the quality of our trades. The checklist would act as a guiding principle before initiating a trade. The trade should comply to the conditions specified in the checklist. If it does, we take the trade; else we just drop it and look for another trade opportunity that complies with the checklist. We can initiate our checklist with the following 2 conditions -
- The stock should form a recognizable candlestick pattern
- S&R should confirm the trade. The stop loss price should be around S&R
- For a long trade, the low of the pattern should be around the support
- For a short trade, the high of the pattern should be around the resistance
Volumes indicate how many shares are bought and sold over a given period of time. The more active the share, higher would be its volume.
| Sl No | Price | Volume | What is the expectation? |
|---|---|---|---|
| 01 | Increases | Increases | Bullish |
| 02 | Increases | Decreases | Caution – weak hands buying |
| 03 | Decreases | Increases | Bearish |
| 04 | Decreases | Decreases | Caution – weak hands selling |
Generally the rule of thumb is as follows:
- High Volume = Today’s volume > last 10 days average volume
- Low Volume = Today’s volume < last 10 days average volume
- Average Volume = Today’s volume = last 10 days average volume
When volume increases substantially, it could mean that large institutions are at play.
If both the price and the volume are increasing this only means one thing – a big player is showing interest in the stock. Going by the assumption that smart money always makes smart choices the expectation turns bullish and hence one should look at buying opportunities for the stock.
It is recommended to avoid trading on low volume days.
We can add a 3rd condition to our checklist
3. Volumes should confirm to the trade
- Simple Moving Average (SMP) - All data points are given equal weightage
- Exponential Moving Average (EMP) - Newer data points are given more weightage.
EMA is quicker to react to the current market price because EMA gives more importance to the most recent data points. This helps the trader to take quicker trading decisions. Hence for this reason, traders prefer the use of the EMA over the SMA.
The moving average can be used to identify buying and selling opportunities with its own merit. When the stock price trades above its average price, it means the traders are willing to buy the stock at a price higher than its average price. This means the traders are optimistic about the stock price going higher. Therefore one should look at buying opportunities. Likewise, when the stock price trades below its average price, one should look at selling opportunities. A trade can be set up as follows -
- Buy (go long) when the current market price turns greater than the 50 day EMA. Once you go long, you should stay invested till the necessary sell condition is satisfied
- Exit the long position (square off) when the current market price turns lesser than the 50 day EMA.
A typical example of this would be to combine a 50 day EMA, with a 100 day EMA. The shorter moving average (50 days in this case) is also referred to as the faster moving average. The longer moving average (100 days moving average) is referred to as the slower moving average.
The entry and exit rules for the crossover system is as stated below:
- Buy (fresh long) when the short term moving averages turns greater than the long term moving average. Stay in the trade as long as this condition is satisfied
- Exit the long position (square off) when the short term moving average turns lesser than the longer term moving average These crossovers are used widely -
- 9 X 21 day for short term trades.
- 25 X 50 for trades lasting over a few weeks
- 50 X 100 for trades lasting upto a few months
- 100 X 200 for long-term investments.
Indicators are independent trading systems introduced to the world by successful traders. Indicators are built on preset logic using which traders can supplement their technical study (candlesticks, volumes, S&R) to arrive at a trading decision. Indicators help in buying, selling, confirming trends, and sometimes predicting trends.
Indicators are of two types namely leading and lagging. A leading indicator leads the price, meaning it usually signals the occurrence of a reversal or a new trend in advance.A majority of leading indicators are called oscillators as they oscillate within a bounded range. A lagging indicator on the other hand lags the price; meaning it usually signals the occurrence of a reversal or a new trend after it has occurred.
Momentum is the rate at which the price changes.
RSI is the most popular leading indicator, which gives out strongest signals during the periods of sideways and non trending ranges. It oscillates between 1 and 100.
RSI = 100 - 100/(1 + RS)
RS = Average Gain/ Average Loss
Average Gain and Loss are calculated over the previous 14 trading sessions. Look here for a detailed explanation.
When the RSI reading is between 30 and 0, the security is supposed to be oversold and ready for an upward correction. When the security reading is between 70 and 100, the security is supposed to be heavily bought and is ready for a downward correction. We can infer the following -
- If the RSI is fixed in an overbought region for a prolonged period, look for buying opportunities instead of shorting. The RSI stays in the overbought region for a prolonged period because of an excess positive momentum
- If the RSI is fixed in an oversold region for a prolonged period, look for selling opportunities rather than buying.
- If the RSI value starts moving away from the oversold value after a prolonged period, look for buying opportunities. For example, the RSI moves above 30 after a long time may mean that the stock may have bottomed out, hence a case of going long.
- If the RSI value starts moving away from the overbought value after a prolonged period, look for selling opportunities.
None of the parameters used while analysing RSI should be treated with rigidity. The fewer days opted for lookback (the 14 day period) more the volatility.
Though invented in the seventies, MACD is still considered as one of the most reliable indicators by momentum traders. Convergence occurs when the two moving averages move towards each other, and a divergence occurs when the moving averages move away from each other.
A standard MACD is calculated using a 12 day EMA and a 26 day EMA. Please note, both the EMA’s are based on the closing prices. We subtract the 26 EMA from the 12 day EMA, to estimate the convergence and divergence (CD) value.
A positive sign tells us that there is positive momentum in the stock, and the stock is drifting upwards. The higher the momentum, the higher is the magnitude (relative to the stock price).
The following can be inferred from MACD spread -
- When the MACD Line crosses the center line from the negative territory to positive territory, it means there is divergence between the two averages. This is a sign of increasing bullish momentum. Therefore one should look at buying opportunities.
- When the MACD line crosses the center line from positive territory to the negative territory it means there is convergence between the two averages. This is a sign of increasing bearish momentum. Therefore one should look at selling opportunities.
A signal for behaviour of MACD line is the 9 day signal line. It is the EMA of MACD line. This line enables us to initiate without the requirement of MACD line crossing the central line. It follows the same principle as the Moving Average Crossovers but is further smoothened out. We can say the following -
- The sentiment is bullish when the MACD line crosses the 9 day EMA wherein MACD line is greater than the 9 day EMA. When this happens, the trader should look at buying opportunities.
- The sentiment is bearish when the MACD line goes below the 9 day EMA. When this happens, the trader should look at selling opportunities.
MACD indicator works quite well when there is a strong trend and is not too useful when the markets are moving sideways.
Bollinger bands (BB) is perhaps one of the most useful indicators used in technical analysis. BB are used to determine overbought and oversold levels, where a trader will try to sell when the price reaches the top of the band and will execute a buy when the price reaches the bottom of the band.
The BB has 3 components:
- Middle line which is The 20 day simple moving average of the closing prices
- An upper band – this is the +2 standard deviation of the middle line
- A lower band – this is the -2 standard deviation of the middle line
The upper and lower bands act as a trigger to intiate a trade. When the current price is near the upper band, short trades can be initiated. It is expected that the price will go back to its average price.
The BB’s upper and lower band together forms an envelope. The envelope expands, whenever the price drifts in a particular direction indicating a strong momentum. The BB signal fails when there is an envelope expansion. This leads us to an important conclusion; BB works well in sideways markets, and fails in a trending market.
We can add another condition to our checklist -
4. Indicators should confirm. (It isn't as important as other conditions)
Fibonacci Ratios :
- f(n)/f(n+1) = 0.618
- f(n)/f(n+2) = 0.382
- f(n)/f(n+3) = 0.236
Fibonacci retracement levels are horizontal lines that indicate where support and resistance are likely to occur.
Whenever the stock moves either upwards or downwards sharply, it usually tends to retrace back before its next move. ‘The retracement level forecast’ is a technique using which one can identify upto which level retracement can happen.
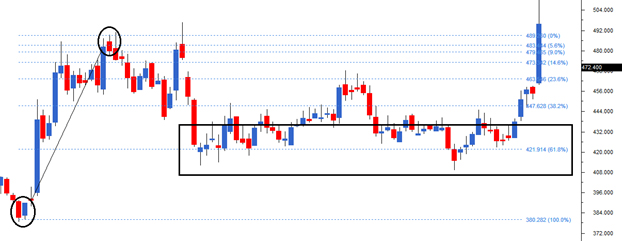
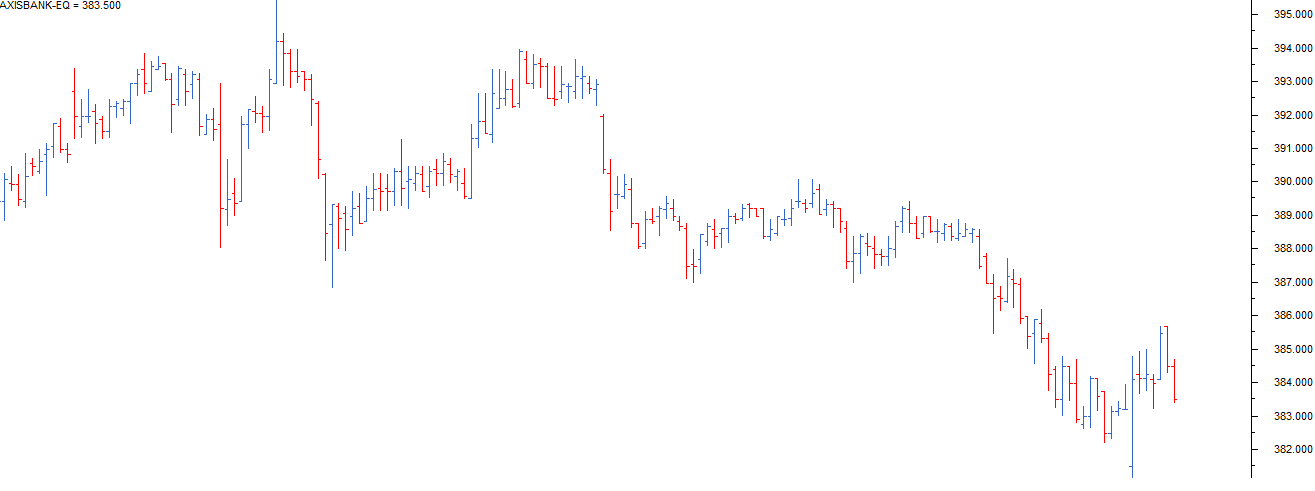
In the above chart, the stock started its rally at Rs.380 and went upto Rs.489. This is Defined as a Fibonacci Up move. A correction that lasts upto a Fibonacci Ratio is expected in the stock. For example, the first level up to which the stock can correct could be 23.6%. If this stock continues to correct further, the trader can watch out for the 38.2% and 61.8% levels. In the above chart, the stock came to Rs.421 before it resumed the rally. Total Fibonacci Up move was Rs.109. 489 - 109* 0.618 = 421. Hence, the stock has retraced upto 61.8%.
The Fibonacci retracements can also be applied to stocks that are falling, in order to identify levels upto which the stock can bounce back.
Fibonacci retracements are movements in the chart that go against the trend. To use the Fibonacci retracements we should first identify the 100% Fibonacci move. The 100% move can be an upward rally or a downward rally. To mark the 100% move, we need to pick the most recent peak and trough on the chart. Once this is identified, we connect them using a Fibonacci retracement tool.
The Fibonacci Retracements can be useful when you wanted to buy a particular stock but you were not able to do so because of a sharp run up in the stock. In such a situation the most prudent action to take would be to wait for a retracement in the stock.
- Indices discounts everything
The stock market indices discount everything which is known & unknown in the public domain. If a sudden and unexpected event occurs, the stock market indices quickly recalibrates itself to reflect the accurate value - There are 3 broad market trends overall
Primary Trend, Secondary Trend, and Minor Trends - The Primary Trend
This is the major trend of the market that lasts from a year to several years. It indicates the broader multiyear direction of the market. While the long term investor is interested in the primary trend, an active trader is interested in all trends. The primary trend could be a primary uptrend or a primary down trend - The Secondary Trend
These are corrections to the primary trend. Think of this as a minor counter reaction to the larger movement in the market. Example – corrections in the bull market, rallies & recoveries in the bear market. The counter trend can last anywhere between a few weeks to several months - Minor Trends/Daily fluctuations
These are daily fluctuations in the market, some traders prefer to call them market noise - All Indices must confirm with each other
We cannot confirm a trend based on just one index. For example the market is said to be bullish only if CNX Nifty, CNX Nifty Midcap, CNX Nifty Smallcap etc all move in the same upward direction. It would not be possible to classify markets as bullish, just by the action of CNX Nifty alone - Volumes must confirm
The volumes must confirm along with price. The trend should be supported by volume. In an uptrend the volume must increase as the price rises and should reduce as the price falls. In a downtrend, volume must increase when the price falls and decrease when the price rises. - Sideway markets can substitute secondary markets
Markets may remain sideways (trading between a range) for an extended period. Example:- Reliance Industries between 2010 and 2013 was trading between 860 and 990. The sideways markets can be a substitute for a secondary trend - The closing price is the most sacred
Between the open, high, low and close prices, the close is the most important price level as it represents the final evaluation of the stock during the day
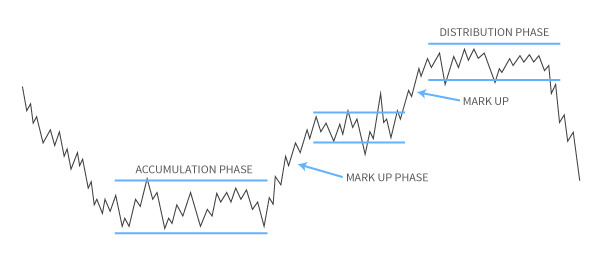
Accumulation Phase - The Accumulation phase usually occurs right after a steep sell off in the market. Buyers would still be hesitant of buying fearing there could be another sell off. Hence the stock price languishes at low levels. This is when the ‘Smart Money’ enters the market.
Smart money is usually the institutional investors who invest from a long term perspective. They invariably seek value investments which is available after a steep sell off. Institutional investors start to acquire shares regularly, in large quantities over an extended period of time. This is what makes up an accumulation phase.
Mark Up Phase - After all the stocks are bought, short term traders sense the occurrence of a support. These factors tend to take the stock price higher. This is called the mark up phase. During the Mark up phase, the stock price rallies quickly and sharply. The most important feature of the mark up phase is the speed. Because the rally is quick, the public at large is left out of the rally.
Distribution Phase - Finally when the stock price reaches new highs (52 week high, all time high), the news reports turn optimistic, business environment suddenly appears vibrant, and everyone (public) wants to invest in the markets. This is when the distribution phase occurs.
The judicious investors who got in early (during the accumulation phase) will start offloading their shares slowly. The public will absorb all the volumes off loaded by the institutional investors (smart money) there by giving them the well needed price support. The distribution phase has similar price properties as that of the accumulation phase.In the distribution phase, whenever the prices attempt to go higher, the smart money offloads their holdings. Over a period of time this action repeats several times and thus the resistance level is created.
Mark Down Phase - Finally when the institutional investors (smart money) completely sell off their holdings, there would be no further support for prices, and hence what follows after the distribution phase is a complete sell off in the markets, also known as the mark down of prices.
Completing the circle, what follows the selloff phase is a fresh round of accumulation phase, and the whole cycle repeats again. It is believed that that entire cycle from accumulation phase to the selloff spans over a few years.
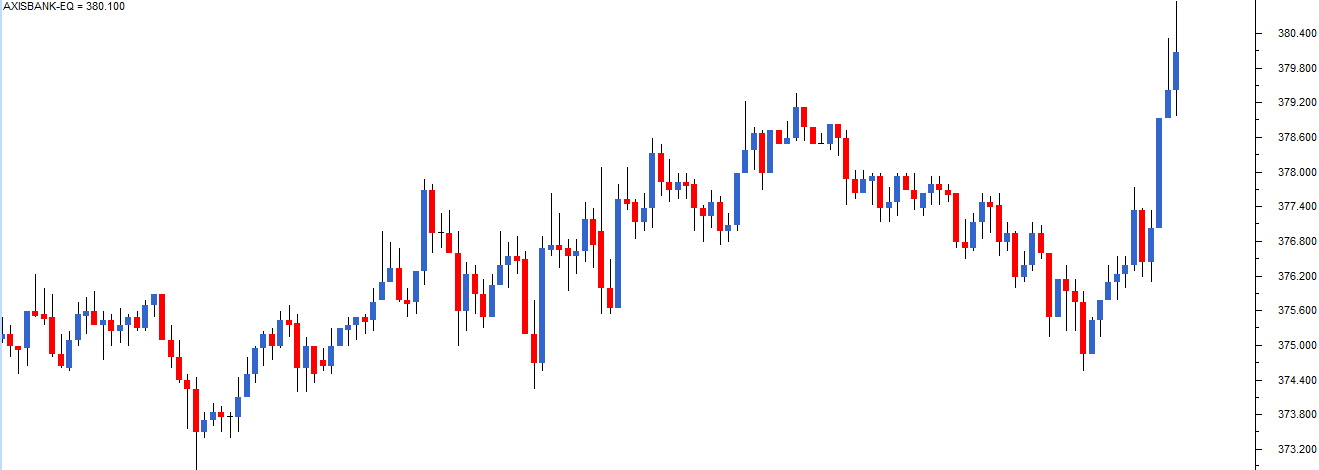
A double bottom formation is considered bullish, and hence one should look at buying opportunities. The two bottom formation must be well spaced in time (2 weeks).
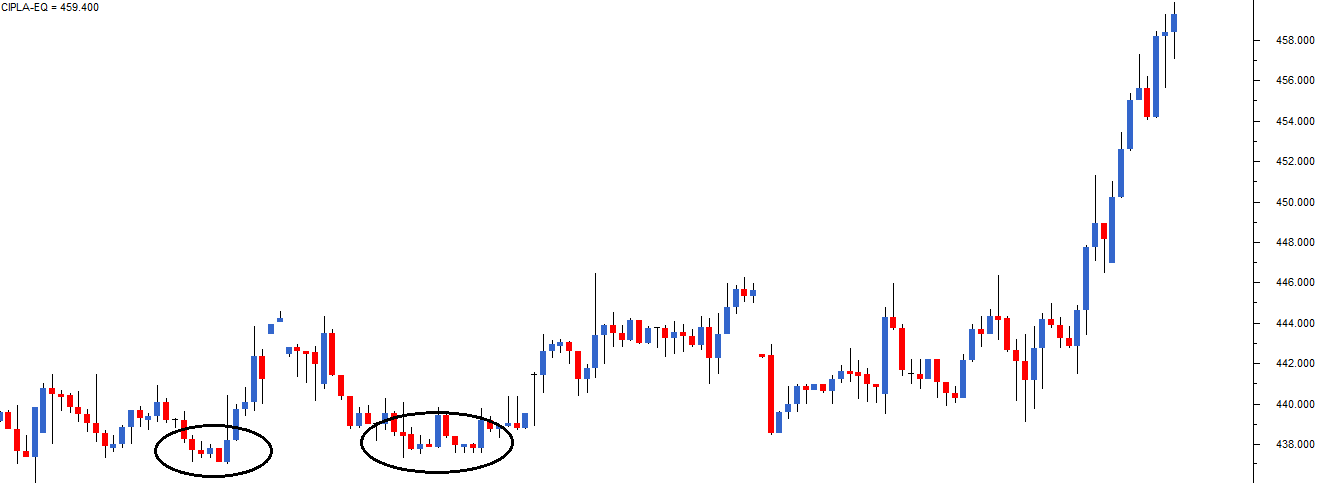
As a rule of thumb the more number of times the price tests, and reacts to a certain price level, the more sacred the price level is considered. Therefore by virtue of this, the triple formation is considered more powerful than the double formation.
The concept of range is a natural extension to the double and triple formation. In a range, the stock attempts to hit the same upper and lower price level multiple times for an extended period of time. This is also referred to as the sideways market. This can be confirmed using the Support and Resistance levels.
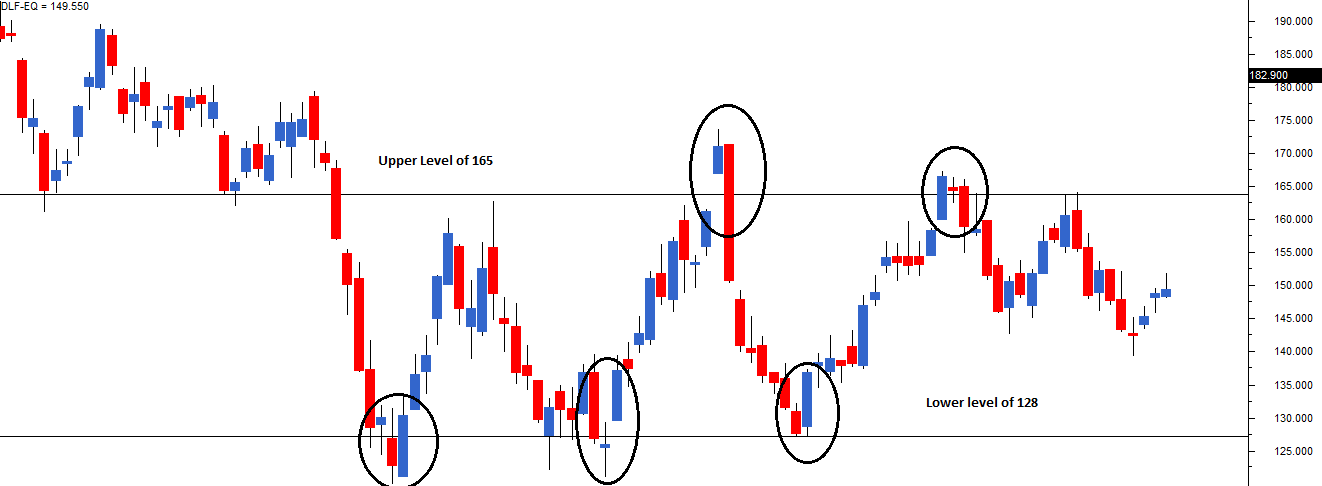
Range Breakout
Sideways Market occurs due to two reasons -
- There are no Fundamental triggers like Budget Announcement, new launches, joint ventures etc to move the market - The range under these circumstances could be quite long lasting until a meaningful trigger occurs.
- Anticipation of big announcement - Till the announcement is made both buyers and sellers would be hesitant to take action and hence the stock gets into the range.
Range breakout refers to a start of a new trend. A false breakout may also occur. A trader can avoid these by analyzing the volumes. A true breakout usually has very high momentum.
One can trade on such breakouts. For example, if a stock starts moving up after a breakout, one can go long placing stop loss at resistance level. The stock is expected to move to a price which is higher than the resistance level by a value equivalent to the range.
Flag Formation
The flag formation usually takes place when the stock posts a sustained rally with almost a vertical or a steep increase in stock prices. Flag patterns are marked by a big move which is followed by a short correction. The price decline can last anywhere between 5 to 15 trading sessions.
With these two events (i.e price rally, and price decline) occurring consecutively a flag formation is formed. When a flag forms, the stock invariably spurts back all of a sudden and continues to rally upwards. A trader can initiate a trade after flag formation.
A flag forms due to many market participants booking profits due to the rally. The stock rallies up after a flag because 'smart money' is still invested and market sentiment is positive.
The RRR is higher than 1.3 for good trades.
- The stock should form a recognisable candlestick pattern
- S&R should confirm the trade. The stop loss price should be around S&R
- For a long trade, the low of the pattern should be around the support
- For a short trade, the high of the pattern should be around the resistance
- Volumes should confirm
- Ensure above average volumes on both buy and sell day
- Low volumes are not encouraging, and hence do feel free to hesitate while taking trade where the volumes are low
- Look at the trade from the Dow Theory perspective.
- Primary, secondary trends
- Double, triple, range formations
- Recognisable Dow formation
- Indicators should confirm
- Scale the trade size higher if indicators confirm to your plan of action
- If the indicators do not confirm go ahead with the original plan
- RRR should be satisfactory
- Think about your risk appetite and identify your RRR threshold
- A beginner can have a high RRR. An active trader can have a RRR of 1.5.
Financial liquidity refers to how easily assets can be converted into cash. Assets like stocks and bonds are very liquid since they can be converted to cash within days. However, large assets such as property, plant, and equipment are not as easily converted to cash.