The idea of repvisforODK was to develop a quick way to visualize data which is stored on ODK Central by creating custom reports. To do so, the package leverages on a variety of other external R packages. Of paramount importance are ruODK for the interaction with the ODK Central API and both ggplot2 & plotly for plotting.
repvisforODK was developed to be accessible not only for people with but also for people without coding skills. Thus, repvisforODK can be used in two ways:
- Code solution: repvisforODK contains several functions that create plots for different question types. These functions can be used individually which enables the user to use them in whatever way fits best for their use case - visualize data on the fly, integrate in already existing code, create a new personalized report etc.
- No Code solution: All functions of repvisforODK are united in an integrated shiny app. The app provides an interface where the user can connect to ODK Central, select the visualizations they desire, set the required parameters and ultimately generate an html report. More details to come below...
The development version from GitHub can be installed using:
require("devtools")
devtools::install_github("swisstph/repvisforODK")
To install the dependency ruODK, you can use:
# Enable the rOpenSci universe
options(repos = c(ropensci = 'https://ropensci.r-universe.dev',
                  CRAN = 'https://cloud.r-project.org'))
install.packages('ruODK')
If you run into further problems when attempting to install the package, you can check out the how-to-install video tutorial. If this doesn't help, feel free to leave a post in the discussion section.
At the moment you cannot install repvisforODK from CRAN because it has not been published yet. When published, installing will be possible through:
install.packages("repvisforODK")This section provides an overview of all functions in repvisforODK. For more detailed information, visit the help page of a function using ?[FUNCTION NAME].
repvisforODK offers 4 functions that visualize metadata of the entire form (1 plot per form) and 3 question-specific functions for responses of the surveyees (1 plot per question of respective question type).
General plots:
submission_goal_donut()
Pie Chart showing received vs. missing submissions referring to a submission goal set by the user.submissions_timeseries_lineplot()
Line chart showing the number of received submissions over the course of the data collection period.heatmap_wday_hourofday()
Heat map of the number of submissions per weekday and hour.heatmap_calendar()
Heat map of the number of submissions on each day of the data collection period.
Question plots:
single_choice_question_pie()
Pie Chart showing the selection percentage of each choice of a single-choice question. Function automatically identifies all single-choice questions in the form and generates a plot for each of them.multiple_choice_question_bar()
Stacked bar chart showing the selection percentage of each choice of a multiple-choice question. Function automatically identifies all multiple-choice questions in the form and generates a plot for each of them.free_text_wordcloud()
Generates a wordcloud based on text from a free text question. Function doesn't automatically identifies free text questions in the form - has to be specified by the user.
The shiny app consists of 2 separate components - the user interface and the server (back-end). Each component's code is accessed by calling the respective function. On top that, there is a third function that calls the UI and the server and launches the app.
ui()
Contains the shiny code for the user interface of the app.server()
Contains the shiny code for the back-end of the app.run_app()
Calls both of the above functions and launches the shiny app.
Apart from visualizing data, repvisforODK also offers an efficient solution for only getting data from ODK Central which is not yet part of data a user is using already. This is useful in situations where a user is already working with ODK Central data in an R session. Instead of downloading all the data of a form which is available, the user can use the following functions to restrict the downloaded submissions to only the ones which are not yet in the data.
get_new_submissions()
Takes existing ODK data (data frame or csv) and downloads only new submissions. In contrast toget_new_submissions_odata(), this function uses the ODK Central REST-API endpoint and not the ODATA endpoint. For detailed information on the implications of the latter visit the function's help page.get_new_submissions_odata()
Takes existing ODK data (data frame or csv) and downloads only new submissions. In contrast toget_new_submissions_odata(), this function uses the ODK Central ODATA endpoint and not the REST-API endpoint. For detailed information on the implications of the latter visit the function's help page.find_missing_instanceIDs()
Takes existing ODK data and finds all instance IDs that are already on ODK Central but not in the data. This function is used within get_new_submissions().
This section contains all non-private functions that are primarily used in other functions but could still be useful for the user to use on their own.
collection_period()
Returns the earliest and latest value of a date/time stamp column.identify_choice_questions()
Finds all questions in an ruODK extended form schema that are choice question (single or multiple).setup_ruODK()
Connects R session to a form on ODK Central which is required in order to use most ruODK functions. Thus, all repvisforODK functions only work if this connection has been established.
The integrated web app consists of three different sections The user has to go through all of them to obtain the final output - a downloadable html report. To launch the app locally on your machine, the function run_app() can be used. Shiny apps when launched through RStudio are by default also run in RStudio. It is, however, recommendable to run them in browser by pressing the "Open in Browser" button because only then all images are displayed correctly.
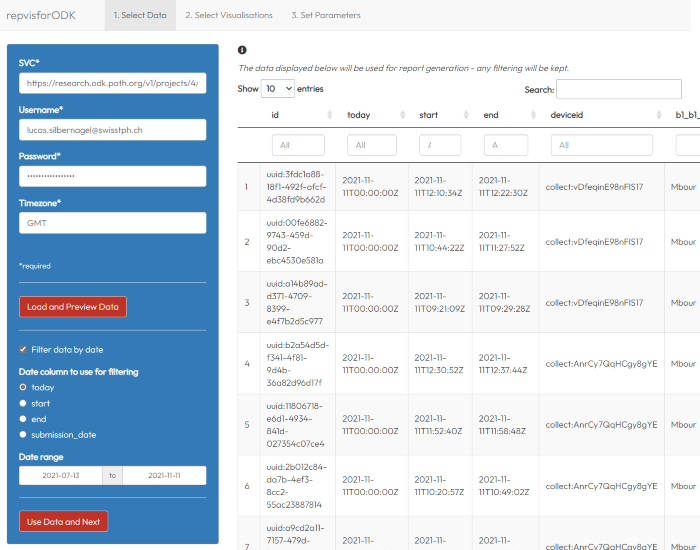
- Select Data
In this section, the data which is used for the report generation is defined. Firstly, one needs to provide ODK Central log in credentials (username and password), the time zone in which the data was collected, and an svc link that specifies the ODK form. The latter can be accessed by clicking on the "Analyze via OData..." button on the the respective from on ODK Central. The actual download of the data is then triggered by clicking the "Load and Preview Data" button in the app. When the data download is successfully completed, the data will be displayed in the main panel.
Secondly, one now has two ways of filtering the data. To apply a date filter, the corresponding check box on the sidebar has to be clicked. This will trigger more input options. The app automatically shows all date/time stamp columns in the data out of which one needs to be chosen. After that, the date range needs to be defined (selected start and end dates are inclusive). The changes made will be directly be reflected in the data preview. Additional filtering can be done through text inputs on top of each column of the previewed data.
Always keep in mind that the previewed data will be used to generate the report - any filters will be kept.
Proceed by clicking on the "Use Data and Next" button.
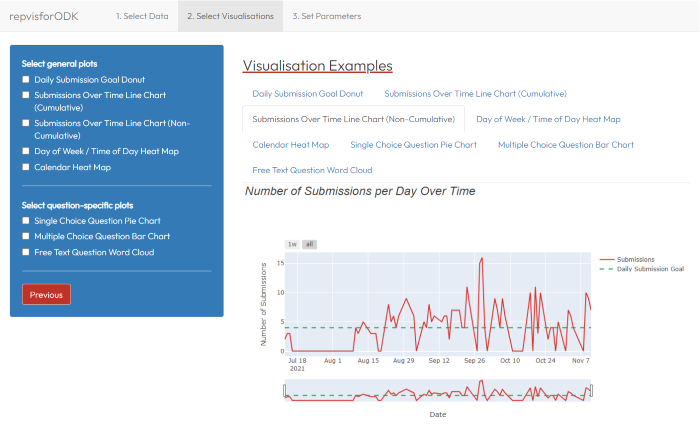
- Select Visualisations
In this section, one or more visualizations can be selected. To do so, one must tick the respective box in the sidebar. As soon as at least one of the plots has been selected, a "Next" button appears which will take you to the last tab.
To get an idea of how the visualizations that are offered look like, there is an exemplary image for each of them available in the main panel. To access them, just click on the respective name.
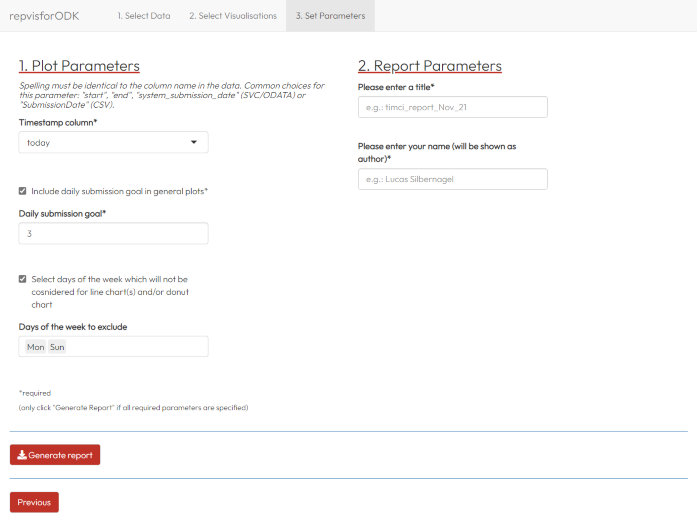
- Set Parameters
In the final section, one must define the parameters necessary to create the report with the visualizations selected.
Depending on the latter, the set of parameters that needs to be defined, can differ. Generally, the app differentiates between plot and report parameters where the former is on the left and the latter on the right hand side of the app. The report parameters are independent from the selected visualizations and have to be defined regardless. All parameters marked with a "*" are required while all others are optional.
After at least all required parameters have been defined, the report can now be generated by clicking the "Generate Report" button. If the app is used in browser, the generated html file will be automatically be stored in your download folder. If the app is run through RStudio, a file explorer window will pop up and one can choose the storage location themselves.
COMING SOON
library(repvisforODK)
## basic example code